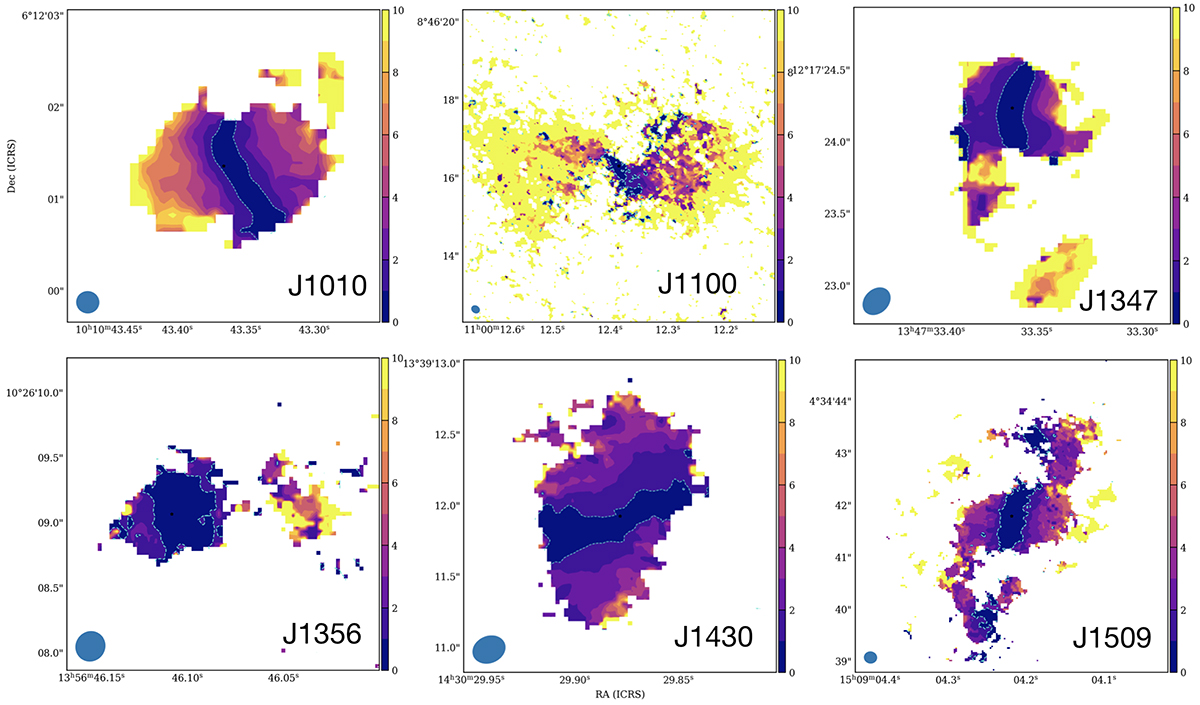
Fig. C.1.
Download original image
CO(2–1) velocity over velocity dispersion (v/σ) maps of the QSO2s. In the case of J1010 (top left panel) CO(3–2) has been used instead. The color bars indicate v/σ ranging from 0 to 10 and the dotted blue line shows the v/σ = 1 contour. The beam sizes are indicated by the blue ellipses at the bottom-left corner of each panel.
Current usage metrics show cumulative count of Article Views (full-text article views including HTML views, PDF and ePub downloads, according to the available data) and Abstracts Views on Vision4Press platform.
Data correspond to usage on the plateform after 2015. The current usage metrics is available 48-96 hours after online publication and is updated daily on week days.
Initial download of the metrics may take a while.