Fig. 11.
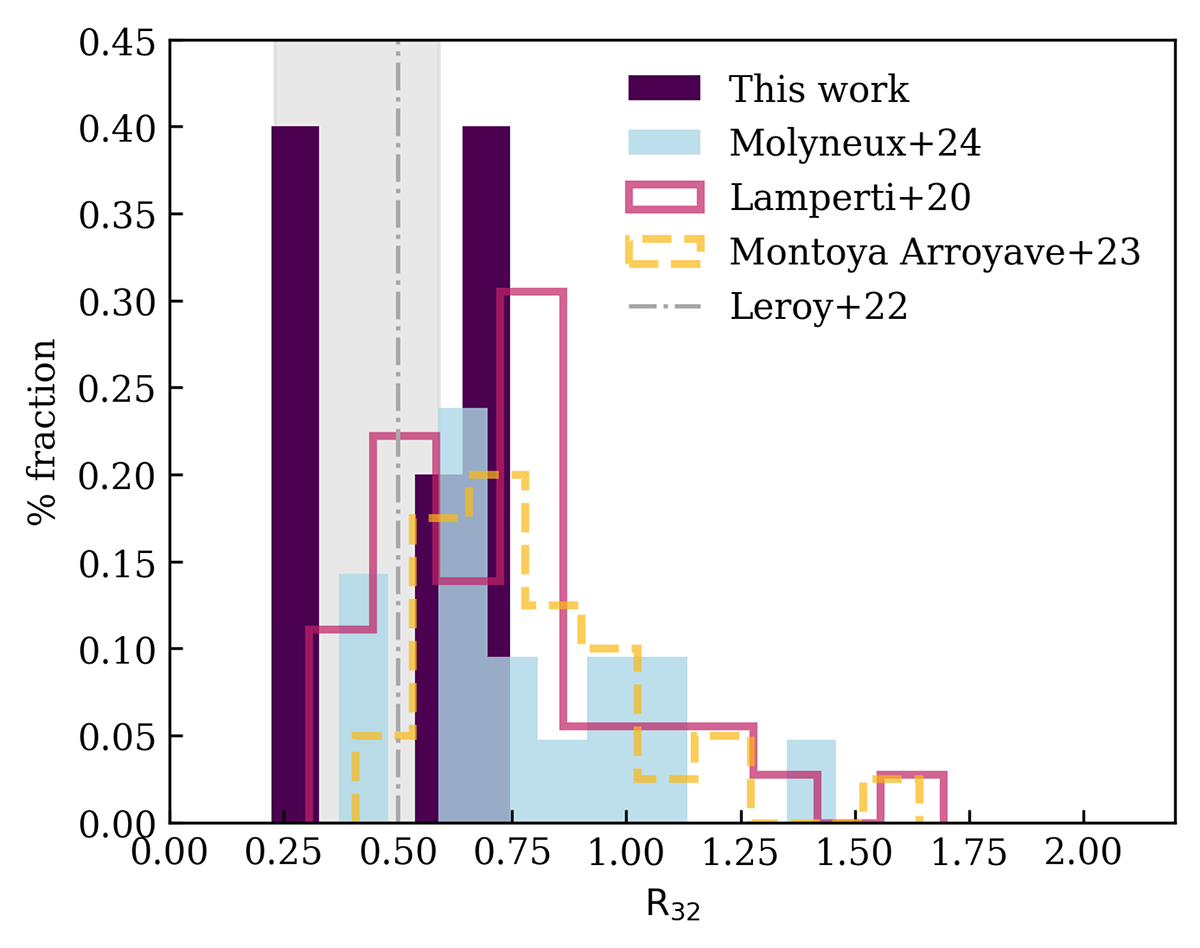
Download original image
Histogram of the integrated R32 for the five QSO2s for which CO(2–1) and CO(3–2) transitions are available. They are shown as filled purple bars. The values measured for a sample of QSO2s at z < 0.2 from Molyneux et al. (2024) are also shown in light blue, for the X-ray selected AGN reported by Lamperti et al. (2020) in pink, of the local ULIRGs presented in Montoya Arroyave et al. (2023) in yellow, and the mean value measured for star-forming disk galaxies from Leroy et al. (2022) is the gray dot-dashed line, with the corresponding interval shown as a shaded gray area.
Current usage metrics show cumulative count of Article Views (full-text article views including HTML views, PDF and ePub downloads, according to the available data) and Abstracts Views on Vision4Press platform.
Data correspond to usage on the plateform after 2015. The current usage metrics is available 48-96 hours after online publication and is updated daily on week days.
Initial download of the metrics may take a while.