Fig. 10.
Download original image
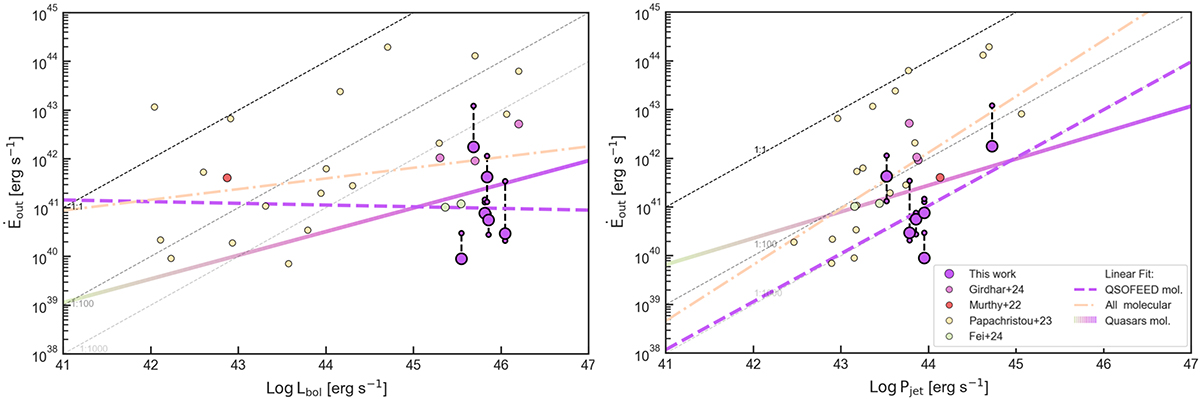
Kinetic power of the outflow vs. bolometric luminosity (left panel) and jet power (right panel). The 1:1, 1:100, and 1:1000 relations are shown as dashed lines in both panels. The dashed purple line in both panels corresponds to the linear fit of the purple circles, which correspond to the molecular outflows of the QSO2s studied here (“QSOFEED mol.”). The diverging color line (“Quasars mol.”) represents the linear fit of the type-1 PG quasars in Fei et al. (2024, green circles), the QSO2s from Girdhar et al. (2024, magenta circles), and the QSOFEED QSO2s (purple circles). The light orange dot-dashed line (“All molecular”) shows the fit of all the molecular outflows mentioned before and those reported by Papachristou et al. (2023, yellow circles) and Murthy et al. (2022, red circles). Symbols and colors are the same as in Figure 9.
Current usage metrics show cumulative count of Article Views (full-text article views including HTML views, PDF and ePub downloads, according to the available data) and Abstracts Views on Vision4Press platform.
Data correspond to usage on the plateform after 2015. The current usage metrics is available 48-96 hours after online publication and is updated daily on week days.
Initial download of the metrics may take a while.