Fig. 1.
Download original image
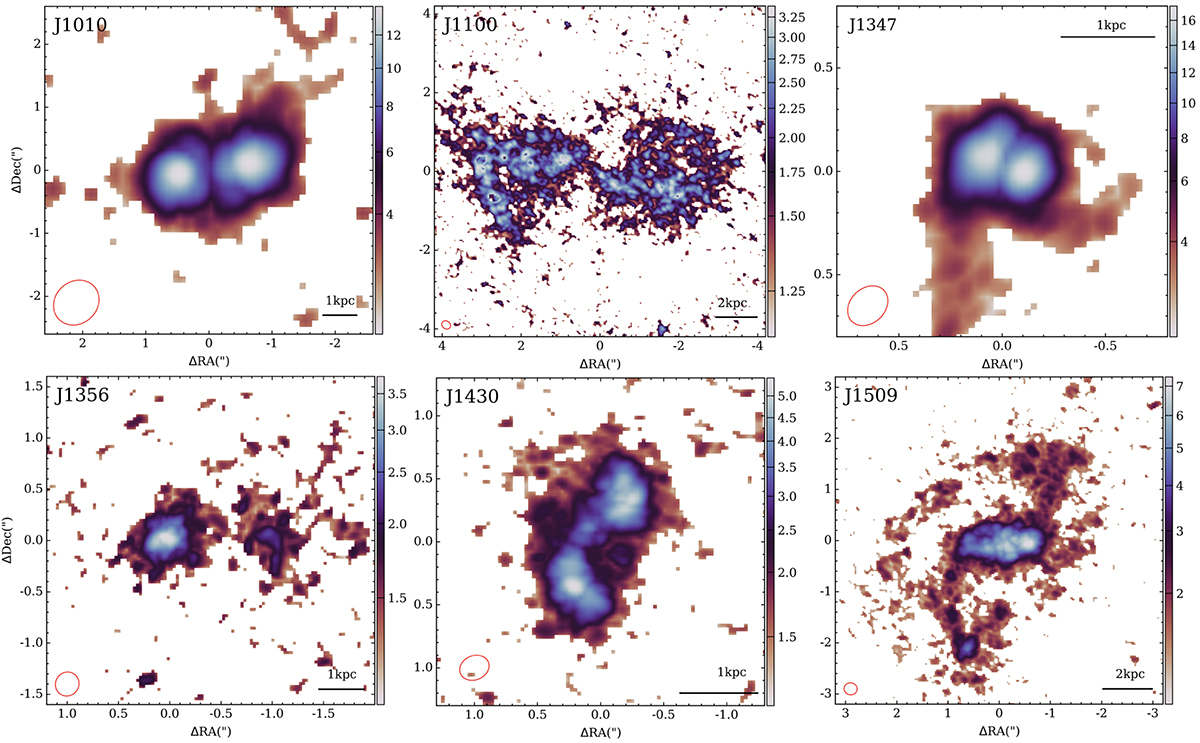
ALMA CO(2–1) peak-intensity maps of the six QSO2s. The color bars indicate the scales of the flux density in mJy. The horizontal black lines indicate the physical scales for each galaxy, and the beam sizes are shown in the bottom left corner of each panel as red ellipses. The CO(2–1) distribution presents a variety of morphologies, such as spiral arms, double peaks, and merger signatures. East is to the left, and north is up.
Current usage metrics show cumulative count of Article Views (full-text article views including HTML views, PDF and ePub downloads, according to the available data) and Abstracts Views on Vision4Press platform.
Data correspond to usage on the plateform after 2015. The current usage metrics is available 48-96 hours after online publication and is updated daily on week days.
Initial download of the metrics may take a while.