Fig. 4.
Download original image
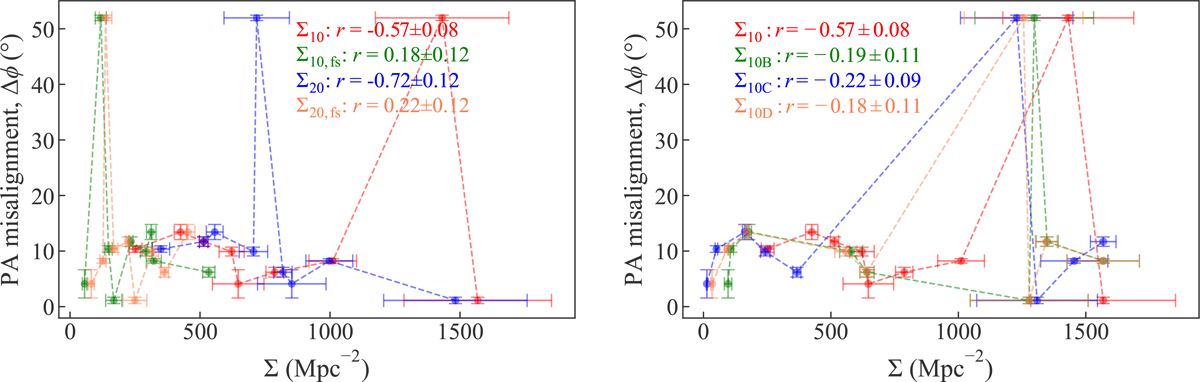
Distribution of the PA misalignment between mass and light, and the local galaxy density, Σ10, and its variations. Left: Variations of Σ10 are based on different galaxy selection criteria, including the number of galaxies considered and flux-based thresholds. Right: Variations correspond to different weighting schemes used in defining Σ10 (i.e., definitions B, C, and D). Systems with low ellipticity (qL>0.9) are excluded from both cases. While the baseline definitions, Σ10 and Σ20, exhibit a moderate to strong correlation with the PA misalignment, other definitions show only weak to very weak correlations. Therefore, we cannot robustly conclude a strong relationship between PA misalignment and local galaxy density.
Current usage metrics show cumulative count of Article Views (full-text article views including HTML views, PDF and ePub downloads, according to the available data) and Abstracts Views on Vision4Press platform.
Data correspond to usage on the plateform after 2015. The current usage metrics is available 48-96 hours after online publication and is updated daily on week days.
Initial download of the metrics may take a while.