Fig. 2.
Download original image
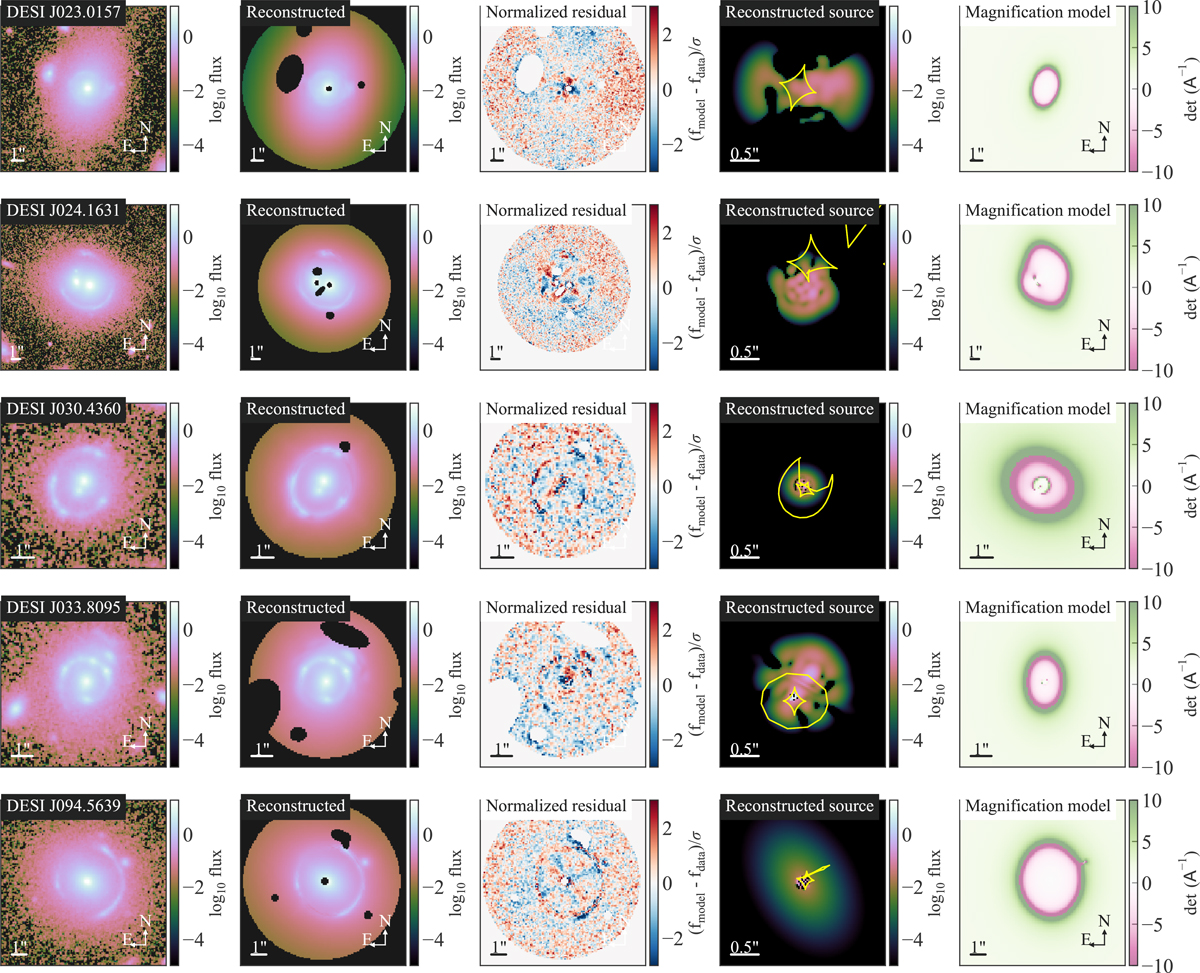
Illustration of lens models for the first 5 out of 15 systems in our sample. First column: Image cutouts of the lensing systems. Second column: Reconstructed images based on the optimized lens model. The dark regions are masked-out pixels. Third column: Residual maps normalized by the noise levels in each pixel. Fourth column: Reconstructed flux distribution of the unlensed source galaxy. The yellow lines show the caustics. Fifth column: The magnification model, computed as the inverse of the determinant of the Jacobian matrix, reveals spatial variations in magnification due to the gravitational lensing effect. For all the lens systems, major lensing features, such as the prominent arcs, are successfully reproduced. Whereas some residuals above the noise levels are present in some cases, they would require greater complexity in the source description (e.g., increasing the shapelet order, nmax) and thus would significantly increase the computational time. From tests done on a few of the complex systems (e.g., DESI J246.0062+01.4836), we find that increasing the complexity further does not substantially alter the lens model parameters of interest. Furthermore, the goodness of fit of these models is typical and sufficient for the science goals and similar analyses in the literature (see, e.g., Shajib et al. 2021).
Current usage metrics show cumulative count of Article Views (full-text article views including HTML views, PDF and ePub downloads, according to the available data) and Abstracts Views on Vision4Press platform.
Data correspond to usage on the plateform after 2015. The current usage metrics is available 48-96 hours after online publication and is updated daily on week days.
Initial download of the metrics may take a while.