Fig. 5
Download original image
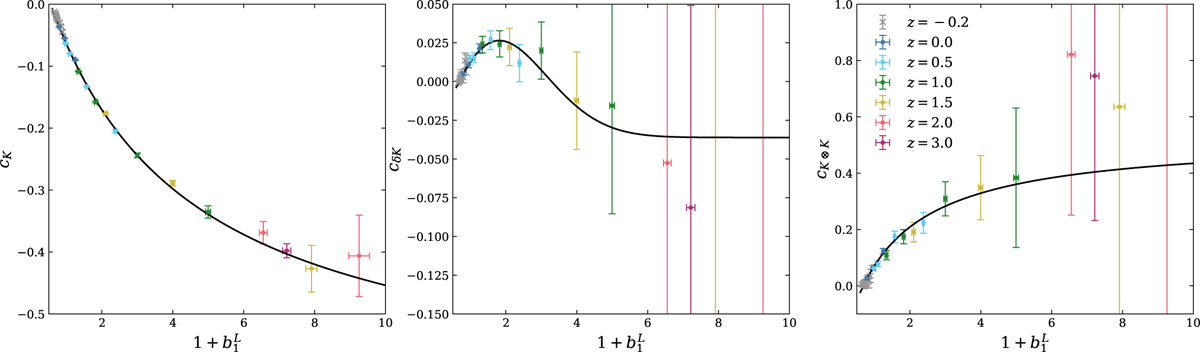
Shape biases in the Planck simulation averaged over bins in ν = δc/σ(M, z), the peak-significance, as a function of linear density bias (b1), also averaged over bins of ν. Different colors represent the redshifts indicated in the legend. Each panel shows the orthogonal distance of the measurements to the fit, in units of the measurement error. The postulated functions provide a good description of the relations between the shape biases and b1.
Current usage metrics show cumulative count of Article Views (full-text article views including HTML views, PDF and ePub downloads, according to the available data) and Abstracts Views on Vision4Press platform.
Data correspond to usage on the plateform after 2015. The current usage metrics is available 48-96 hours after online publication and is updated daily on week days.
Initial download of the metrics may take a while.