Fig. 1
Download original image
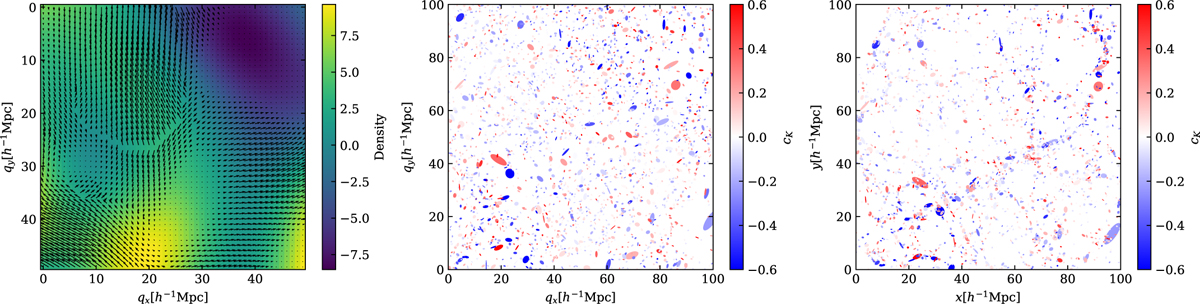
Illustration of halo shapes in a simulation slice and their relation to the underlying density and tidal fields. Left: density field linearly extrapolated to z = 0 (background), with a large set of small arrows superimposed. The sizes of these small arrows are scaled to the local projected tidal field’s largest eigenvalue, and their direction is that of the corresponding eigenvector. Middle: halos (colored ellipses) centered at their Lagrangian positions. Their shapes are those of the projected shape tensor estimated for the FoF group; their color corresponds to the value of their three-dimensional shape-alignment bias. Right: same as the middle panel except now the halos are at their final Eulerian positions.
Current usage metrics show cumulative count of Article Views (full-text article views including HTML views, PDF and ePub downloads, according to the available data) and Abstracts Views on Vision4Press platform.
Data correspond to usage on the plateform after 2015. The current usage metrics is available 48-96 hours after online publication and is updated daily on week days.
Initial download of the metrics may take a while.