| Issue |
A&A
Volume 699, July 2025
|
|
|---|---|---|
| Article Number | A257 | |
| Number of page(s) | 13 | |
| Section | Extragalactic astronomy | |
| DOI | https://doi.org/10.1051/0004-6361/202452961 | |
| Published online | 14 July 2025 | |
Properties of giant radio galaxies larger than 3 Mpc
1
Thüringer Landessternwarte, Sternwarte 5, D-07778 Tautenburg, Germany
2
Permanent address: Depto. de Astronomía, DCNE, Univ. de Guanajuato, Callejón de Jalisco s/n, C.P. 36023 Guanajuato, Mexico
3
Hamburg Observatory, University of Hamburg, Gojenbergsweg 112, 21029 Hamburg, Germany
⋆ Corresponding author: This email address is being protected from spambots. You need JavaScript enabled to view it.
Received:
11
November
2024
Accepted:
13
May
2025
Abstract
Context. Giant radio galaxies (GRGs) are radio galaxies with radio emission exceeding 0.7 Mpc in physical size. Recently, the GRG sample has grown large enough to study the extreme end of the GRG size distribution.
Aims. We examine the properties of GRGs with largest linear sizes greater than 3 Mpc to shed light on their nature and origin.
Methods. We selected, corroborated, and, where necessary, revised the largest GRGs from the literature. We added to these the GRGs identified in our own search of modern radio survey images, combined with optical surveys and catalogues of spectroscopic and photometric redshifts, to determine their projected linear radio size. We studied their radio power–size relation, lobe asymmetry, association with galaxy clusters, and bending angles.
Results. We present an unprecedented sample of 142 GRGs larger than 3 Mpc, of which 69 are newly identified in this work. The sample includes six GRGs with projected linear sizes exceeding 5 Mpc and reaching up to 6.6 Mpc. We find that GRGs larger than 3 Mpc are distributed in redshift and radio luminosity indistinguishable from those of smaller GRGs. The same applies to the fraction of quasars among their hosts. At most, a single GRGs larger than 3 Mpc can be classified as a clear Fanaroff-Riley (FR) type I source, and only six per cent deviate from a clear FR II radio morphology. One quarter of our GRGs show very diffuse lobes typical for remnant radio galaxies, and only 59 per cent show indications of hotspots in at least one lobe, with 38 per cent featuring a hotspot in both lobes. As in the case of smaller radio galaxies, the shorter lobe is most often also the brighter one. We find tentative evidence that the bending angle decreases with GRG size, but no trend with redshift is detected. The fraction of GRGs > 3 Mpc associated with catalogued clusters of galaxies is around 15 per cent, and thus indistinguishable from that of smaller GRGs. The bending angles of GRGs > 3 Mpc in known clusters are larger than those of GRGs not associated with clusters.
Key words: galaxies: jets
© The Authors 2025
 Open Access article, published by EDP Sciences, under the terms of the Creative Commons Attribution License (https://creativecommons.org/licenses/by/4.0), which permits unrestricted use, distribution, and reproduction in any medium, provided the original work is properly cited.
This article is published in open access under the Subscribe to Open model. This email address is being protected from spambots. You need JavaScript enabled to view it. to support open access publication.
1. Introduction
Radio galaxies (RGs) exhibit a wide range of sizes. The largest are known as giant radio galaxies (GRGs), typically defined as RGs with projected largest linear sizes (LLS) in excess of 700 kpc (Willis et al. 1974; Barthel et al. 1985; Kuźmicz et al. 2018; Dabhade et al. 2023). They are relatively rare, with a number density of around five per (100 Mpc)3 (Oei et al. 2023a), or a sky density of about three per square degree (Simonte et al. 2023) in the deepest currently observed fields. GRGs are important for studying the intergalactic medium and the evolution of radio jets. Their existence suggests that radio jets can remain active for tens of megayears and avoid disruption from interactions with the ambient medium, even when the Universe was around ten times denser than it is today. GRGs may also play an important role in magnetising intergalactic space (Kronberg et al. 1986; Ishwara-Chandra & Saikia 1999; O’Sullivan et al. 2023). In a recent paper, Oei et al. (2024) note that a single void-penetrating lobe could fill its void with a magnetic field of strength B ∼ 10−16 − 10−15 G within a Hubble time.
Numerous radio surveys, such as the Faint Images of the Radio Sky at Twenty-cm (FIRST, Becker et al. 1995), the Westerbork Northern Sky Survey (WENSS, Rengelink et al. 1997), the National Radio Astronomy Observatory (NRAO) VLA Sky Survey (NVSS, Condon et al. 1998), the Sydney University Molonglo Sky Survey (SUMSS, Mauch et al. 2003), and the recent surveys with the Australian Square Kilometre Array Pathfinder (ASKAP), such as the Evolutionary Map of the Universe (EMU, Norris et al. 2021), and the Rapid ASKAP Continuum Survey (RACS, McConnell et al. 2020), have uncovered around 1000 GRGs (Ishwara-Chandra & Saikia 1999; Lara et al. 2001; Schoenmakers et al. 2001; Machalski et al. 2001; Saripalli et al. 2005; Kuźmicz & Jamrozy 2012, 2021; Kuźmicz et al. 2018; Dabhade et al. 2017, 2020a; Brüggen et al. 2021; Andernach et al. 2021; Gürkan et al. 2022; Mahato et al. 2022; Delhaize et al. 2021). In addition, the LOw-Frequency ARray (LOFAR, van Haarlem et al. 2013), with its high resolution and sensitivity to sources with very low surface brightness, marks the beginning of a new era in the study of very large and high-redshift RGs. The LOFAR Two-metre Sky Survey (LoTSS, Shimwell et al. 2019, 2022) has led to the identification of approximately 10 000 GRGs (Dabhade et al. 2020b; Simonte et al. 2022; Oei et al. 2023a, Mostert et al. 2024).
Simonte et al. (2024) find differences in environmental densities between GRGs and smaller RGs. They show that GRGs are preferentially found in sparser environments compared to smaller RGs, and present evidence that larger sources exhibit steeper integrated spectral indices, suggesting that GRGs are late-stage versions of RGs. While the majority of GRGs inhabit underdense environments, Dabhade et al. (2020b) and Andernach et al. (2021) report that between ten and 20 per cent of GRGs are located in clusters, and recently, Sankhyayan & Dabhade (2024) found an even higher percentage of approximately 24 per cent, as well as a smaller average linear size of GRGs in clusters.
Despite these recent advances, the origin of the Mpc-sized GRGs remains unclear. Existing RG models suggest that only a limited set of conditions involving jet power, environmental factors, host galaxy characteristics, and source age can account for the immense size of GRGs (Turner & Shabala 2015; Hardcastle 2018; Turner et al. 2023).
Substantial progress in GRG discovery has led us to examine the extreme end of the GRG population, focussing on GRGs with LLS > 3 Mpc. This sample currently comprises 142 GRGs, including six with LLS > 5 Mpc, which are discussed here in detail for the first time. We note that there is no physical reason for adopting a threshold of 0.7 Mpc for the definition of GRGs, nor for our threshold of 3 Mpc. The latter value is chosen to select the largest possible sample of physically largest GRGs for which it is still manageable to measure the parameters studied. Our sample corresponds to about one per cent of all known GRGs larger than 0.7 Mpc, motivating us to search for features that distinguish such extreme GRGs from smaller ones.
The structure of this paper is as follows. In Sec. 2, we describe our sample. In Sec. 3, we present our results, focussing on the power-size diagram, the asymmetry and the bending angles. In Sec. 4, we discuss the implications and present our conclusions. Throughout this paper we use standard cosmological parameters: H0 = 70 km s−1 Mpc−1, Ωm = 0.3, and ΩΛ = 0.7. We define the radio spectral index α according to Sν ∝ να. Position angles (PA) on the sky are quoted from north through east.
2. The sample of GRGs
Over the past 12 years one of us (H.A). (see e.g. Andernach et al. 2012; Villarreal Hernández & Andernach 2018) has compiled a growing list of extended RGs, including information on their exact host position, host name, apparent magnitude, redshift, angular and linear size of the radio emission, and a crude radio-morphological classification. The list comprises all GRGs from dozens of published papers, which are then verified, corrected, or discarded as necessary. However, its main content derives from independent visual inspection of radio survey images at various frequencies and angular resolutions, combined with optical or mid-infrared surveys to identify the host objects. For the present study, we also recently inspected large portions of the Rapid ASKAP Continuum Survey (RACS, McConnell et al. 2020) at 888 MHz, as well as all 651 MeerKAT pointings from the MeerKAT Galaxy Cluster Legacy Survey (MGCLS, Knowles et al. 2022), the MeerKAT Absorption Line Survey (MALS) DR2 (Wagenveld et al. 2024), and the MeerKAT follow-up of GLEAM 4-Jy (G4Jy) sources by Sejake et al. (2023). The recent completion of all three epochs of the Very Large Array Sky Survey (VLASS, Lacy et al. 2020)1, as well as the recent release of the median stack of these2 has also aided in finding or revising the hosts of previously known GRGs, at least for those at Dec > −40°. For our method to measure the largest angular radio size (LAS) in radio survey images, we refer to Sec. 2 of Simonte et al. (2022). A growing number of both spectroscopic and photometric redshift catalogues (see Simonte et al. 2024) is then used to determine the distance to the hosts and convert their LAS to their (projected) largest linear size (LLS). Currently, the compilation contains 28 700 extended radio sources with a median LAS of 2.0′, a median redshift of 0.47, and a median LLS of 0.61 Mpc, with more than 12 000 GRGs larger than 700 kpc. We note that our LLS values denote the projected lengths on the plane of the sky. Since most GRGs will not lie in that plane, Oei et al. (2023b) use a statistical deprojection algorithm to approximate the real physical lengths. We refrain from doing this here due to the uncertainties involved.
In Fig. 1, we show the provenance of the GRG discoveries in terms of the radio surveys in which they were first identified. Considering both the published GRGs and our own unpublished findings, LOFAR provides 55 per cent of the GRGs in our sample, with the ASKAP surveys providing the second-largest fraction at 20 per cent.
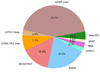 |
Fig. 1. Provenance of GRGs larger than 3 Mpc. Counterclockwise from the top, the categories are as follows: LOFAR publ.: GRGs found and published from LoTSS (Dabhade et al. 2020b; Oei et al. 2023a; Mostert et al. 2023), LoTSS Deep (Simonte et al. 2024; Bondi et al. 2024), and LoTSS DR2 new, which refers to our own discoveries from LoTSS DR2 images; the National Radio Astronomy Observatory (NRAO) VLA Sky Survey (NVSS, Condon et al. 1998) and Faint Images of the Radio Sky at Twenty-cm (FIRST, Becker et al. 1995),; recent surveys with the Australian Square Kilometre Array Pathfinder (ASKAP, McConnell et al. 2020; Norris et al. 2021); the Sydney University Molonglo Sky Survey (SUMSS, Mauch et al. 2003); the Murchison Widefield Array surveys (MWA, Offringa et al. 2016; Hurley-Walker et al. 2017, 2022; Lynch et al. 2021); the Westerbork Northern Sky Survey (WENSS, Rengelink et al. 1997), obtained with the Westerbork Synthesis Radio Telescope (WSRT); and the MeerKAT MALS DR2 (Wagenveld et al. 2024). |
The median redshift of our sample is zmed = 0.67, where 33 per cent of the redshifts are spectroscopic (see Table A.1). Sixteen per cent of the GRGs are either spectroscopically confirmed quasars or quasar candidates (defined here as hosts with either stellar appearance and/or WISE colours typical of quasars). This fraction is very similar for samples of GRGs in the LLS range between 1 and 3 Mpc. For example, for the 180 GRGs listed in Andernach et al. (2021) with LLS from 1 to 3 Mpc, the median redshift is zmed = 0.55 and the median power is log P145 MHz/(W/Hz) = 26.3, with 15 per cent of these being quasars. For the 128 GRGs LLS from 1 to 3 Mpc in the LoTSS deep fields found by Simonte et al. (2024), these values are zmed = 0.76, log P145 MHz/(W/Hz) = 25.7, and 13 per cent, respectively. Since the latter is the highest-sensitivity radio survey yet searched for GRGs, it is not surprising that their median redshifts are higher and their median radio power is lower.
In Fig. 2, we show the sky distribution of all 142 GRGs, where 65 per cent of the sources lie in the northern sky. Only 12 GRGs lie within 20.3° of the Galactic plane, and all but one of these, J1821+2639, were newly discovered by us.
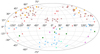 |
Fig. 2. Sky distribution of our sample in equatorial coordinates, with the same colour coding as in Fig. 1. |
Although GRGs lie preferentially in underdense regions (Simonte et al. 2024), no relation between LLS and ambient galaxy has been found (Komberg & Pashchenko 2009; Lan & Prochaska 2021). In fact, a fraction of GRGs are also known to lie in overdense regions, such as in clusters of galaxies and even brightest cluster galaxies (hereafter BrClGs), and Dabhade et al. (2020b) and Andernach et al. (2021) show that between ten and 20 per cent of GRGs reside in clusters or groups. It is difficult to study this for our full GRG sample, as its median redshift of z ∼ 0.67 implies that, for fewer than half of these GRGs, a cluster at their redshift could be identified in current deep optical survey images. However, in Sect. 3.4 we show that, even with currently available data, the cluster association fraction is the same for GRGs larger than 3 Mpc and those smaller than this.
3. Results
3.1. Power–size (P − D) diagram
It is instructive to plot radio power against linear size in a so-called P − D diagram (Baldwin 1982). It has been suggested that every radio source follows a specific evolutionary track in this diagram, which depends on source properties such as jet power or the environment (see Ishwara-Chandra & Saikia 1999; Machalski et al. 2004; Hardcastle 2018).
However, radio powers are not readily available for most GRGs of any size, as this requires careful integration of their total flux densities from the best available survey images. We performed this for our sample using the draw option of the Aladin software (Bonnarel et al. 2000), correcting the resulting pixel sums by the ratio of beam to pixel area for the respective survey images used, and comparing, where possible, with source catalogues available for these surveys. The integration areas were drawn by hand, avoiding sources believed to be unrelated to the GRG. We note that a significant fraction of GRGs have lobes of very low surface brightness, for which total flux densities may have uncertainties of more than 50 per cent. From the distribution of the derived radio powers, we are nevertheless confident that our results are reasonable, but we refrain from quoting quantitative error values. Since most GRGs were found in LoTSS at 145 MHz, the fluxes we derived from the best available survey images were then converted from the respective survey frequency to 145 MHz, assuming a spectral index of −0.8.
We show the positions of our GRG sample in the P − D diagram in Fig. 3. If GRGs are old radio galaxies, it is expected that they are less powerful than smaller radio sources. Hence, there are no GRGs in the upper right corner of Fig. 3, where very powerful and large RGs should reside. For a giant source, the integrated signal-to-noise ratio (S/N) is proportional to the integrated flux divided by the angular size. Applying this to the P − D diagram, the radio power P on the y-axis is proportional to the integrated surface brightness, and the LLS on the x-axis is proportional to the angular size (all neglecting redshift effects). This means that the lines of constant S/N increase linearly with LLS, which explains the lack of GRGs in the bottom right corner.
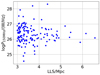 |
Fig. 3. Power–size diagram for 139 of our 142 GRGs. The logarithm of the radio power is given at a frequency of 145 MHz. Measurements at other frequencies are extrapolated assuming a spectral index of α = −0.8. |
We draw particular attention to the four high-luminosity outliers with log P/(W/Hz) > 27.5 and the two low-luminosity outliers at log P/(W/Hz) < 25 that lie outside the bulk of the sources. Here, we do not attempt to model their powers within the framework of evolutionary models, but we suspect this may prove difficult unless they possessed very high powers when the sources were smaller. These sources are interesting cases for source models and may help constrain additional mechanisms, such as re-acceleration or other processes. Below, we discuss the four overluminous GRGs in order of increasing LLS, followed by the two underluminous GRG.
J1102+1345 has a very regular FR II structure in RACSlow (Hale et al. 2021), RACS-mid (Duchesne et al. 2023), and VLASS (Lacy et al. 2020), with a clear radio core detected. We measured zspec = 0.671 based on a spectrum obtained with the 10-m Gran Telescopio de Canarias (GTC). The eastern hotspot has the bluish galaxy SDSS J110304.71+134542.9 superposed, which is very faint in WISE and for which LAMOST3 quotes zspec = 0.059. The VLASS image shows the hotspot emission clearly displaced from this galaxy; thus, we have no evidence that this galaxy contributes to the high radio luminosity of this GRG.
J0101+5052 is located at Galactic latitude b = −12° (extinction of Ar = 0.5 mag). Images from the VLASS survey show two compact sources along the major axis. We prefer the optically fainter southern source (listed in Table A.1), as it has a higher VLASS flux and more AGN- or QSO-like WISE colours. The optically brighter northern source coincides with the Pan-STARRS object (Flewelling et al. 2020) PSO J015.4837+50.8932, for which we found two photometric redshifts (Beck et al. 2021, 2022) with a mean of zphot = 0.225, which would lead to an LLS of 1.32 Mpc and to a moderate log P145 MHz/(W/Hz) = 26.0.
J1558−2138 is located at Galactic latitude b = +23.4° (extinction of Ar = 0.7 mag) and was observed as G4Jy 1289 with MeerKAT by Sejake et al. (2023), who do not propose a host. The source is very diffuse, but both the MeerKAT and VLASS images show a point source coincident with the host we propose in Table A.1. No photometric redshift for it is available in the literature, but we consider our estimate of 0.55 conservative in view of its faintness (i = 21.47 in the DESI Legacy Survey4. The source is the most complex and has the highest (though difficult to measure) bending angle.
However, Quici et al. (2025) identify this source as a remnant RG associated with 2MASX J15590200−2140032 (while the authors do not say this explicitly, this is the only object that complies with the redshift search method described in their article). This is the brightest galaxy near the geometric centre of the source and is faintly detected in RACS-low (McConnell et al. 2020) and RACS-mid (Duchesne et al. 2023), and possibly in the MeerKAT image by Sejake et al. (2023), but is ten times fainter in VLASS than the host proposed in Table A.1. We therefore consider 2MASX J15590200−2140032 a less likely host, but we cannot exclude this possibility. If it were the host, the LLS of the source would be a more modest 0.87 Mpc. Given its large bending angle, its removal from the sample would not change our conclusions and would, in fact, make the null hypothesis of no change in bending angle as a function of LLS above 3 Mpc slightly more likely.
J0226+5927 is located at Galactic latitude b = −1.2° (extinction of Ar = 2.3 mag) and was described by Bassani et al. (2021) within a soft γ-ray-selected GRG sample, where it appears as SWIFT J0225.8+5946. The host is also detected in the optical as PSO J036.6064+59.4640, with iK = 20.63. We estimated its redshift based on its QSO-like WISE colours and use Fig. 2 of Krogager et al. (2018) to infer a redshift of z ∼ 1.3.
The two sources with the lowest radio power are J0911+5440 and J0955−0744.
J0911+5440, with log P145 MHz/(W/Hz) = 24.6, has an inner double-jet feature of 1.4′ length and detached, very low surface brightness lobes, similar to those of J0814+5224 (also known as ‘Alcyoneus’, cf. Oei et al. 2022). It is possible that the total flux of these lobes, and thus its radio power, is higher than that determined from the LoTSS DR2 image.
J0955−0744, with log P145 MHz/(W/Hz) = 24.9, was discovered by L. Rudnick in a tile of the EMU main survey (Hopkins et al. 2025). It has a straight and regular FR II morphology, and its low radio power is likely due to the combination of the high sensitivity of EMU and the low redshift (zphot = 0.185) of its host.
3.2. GRGs larger than 5 Mpc
Our sample contains six GRGs with LLS > 5 Mpc, as shown in Fig. 4. Three of these are included in the LOTSS paper by Hardcastle et al. (2023), and the other three were identified by us.
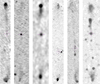 |
Fig. 4. The six known GRGs larger than 5 Mpc. Images from LoTSS DR2 are arranged in increasing order of linear size from left to right, with their host galaxy marked by a magenta cross. To save space, all radio galaxies have been rotated so that their major radio axis is vertical. The GRGs are (with their LAS in arcmin, LLS in Mpc, and real PA on the sky, from N through E, listed in parentheses): J1108+2916 (11.6′, > 5.2, 31°), J0901+4420 (11.7′, > 5.4, 170°), J1753−0332 (13.6′, 5.46, 152°), J0103+2305 (24.1′, > 5.9, 101°), J1529+6015 (13.2′, 6.16, 26°), and J0838+5327 (17.2′, 6.6, 22°). The lower limits for the LLS values are due to assuming the lowest reasonable host redshift. |
These six GRGs are, in order of increasing LLS: J1108+2916 (LLS > 5.2 Mpc), J0901+4420 (LLS > 5.4 Mpc), J1753-0332 (LLS = 5.46 Mpc, J0103+2305 (LLS > 5.9 Mpc), J1529+6015 (LLS > 6.16 Mpc), and J0838+5327 (LLS > 6.58 Mpc). All six are very straight with bending angles of ≤3.8°. However, according to Oei et al. (2022), the GRG ‘Alcyoneus’ (J0814+5224) would be the next-largest, with LLS = 5.0 Mpc and a bending angle of 22° (see sect. 3.5). Using our method to measure the LAS, we find an LLS of 4.74 Mpc. Thus, it stands out as having the largest bending angle of all GRGs with LLS > 3.7 Mpc. Below, we discuss the six GRGs larger than 5 Mpc individually.
3.2.1. J0103+2305
This source was taken from Sect. 10.3 of Hardcastle et al. (2023) where it is tentatively identified with a very faint host: DESI J015.8514+23.0696, r = 22.33, SDSS J010324.36+230410.7, and WISEA J010324.31+230410.8, which coincide with an apparent strong radio core in LoTSS DR2. This object has various inconsistent photometric redshifts of 0.166 (Brescia et al. 2014), 0.302 (Ahumada et al. 2020), 1.07 (Zhou et al. 2021), and 1.7 (Duncan 2022). Given its QSO-like WISE colours and faint optical magnitude, a redshift near 1 seems most reasonable. However, with LAS = 24.1′, this would lead to LLS = 11.6 Mpc, or twice the size of the largest currently known GRG. Hence, we consider this host to be unlikely. Although the radio core is slightly extended along PA = 111° in VLASS (Gordon et al. 2021), that is, close to the orientation axis of the lobes, it is also listed as the blazar candidate BROS J0103.4+2304 by Itoh et al. (2020), which also argues against it being the host of a GRG. Our detailed visual inspection of the region revealed three optically brighter and less distant hosts, which are (from east to west): SDSS J010329.76+230454.7 (zphot ∼ 0.3), SDSS J010326.59+230457.9 (zphot ∼ 0.2), and SDSS J010324.53+230502.8 (zspec = 0.265 from SDSS DR16; Ahumada et al. 2020). We propose SDSS J010324.53+230502.8, the westernmost of these, as the most likely host, since it is the brightest radio source in LoTSS DR2 and the only one detected in a stack of all three VLASS epochs5, with flux densities of ∼1.7 mJy at 144 MHz and 0.4 mJy at 3 GHz, yielding a spectral index of α = −0.5. Taking z = 0.265 as a lower limit for the (still to be confirmed) host of this GRG, we find a minimum LLS of 5.9 Mpc.
3.2.2. J0838+5327
We found this source in the LoTSS DR2 maps. It is a restarted (or ‘double-double’) GRG with an inner pair of lobes, clearly featuring a southern arm ending in a hotspot 3.2′ from the host. However, the extent of the northern inner arm is less clear. We propose that the northern inner hotspot is ILT J083805.57+532841.7, located ∼1.6′ from the host, because further north there are three compact radio sources superposed near the main radio source axis: SDSS J083811.03+533032.7 (zspec = 0.5386 from SDSS DR16) ∼3.6′ from the host; the late-type face-on galaxy 2MASX J08381599+5332160 (zspec = 0.06247 from SDSS DR16) ∼5.5′ from the host; and ∼7.9′ from the host there is ILT J083822.18+533427.7, the optical counterpart of which is hidden in the glare of a bright star ∼9″ WSW of the radio source. The length ratios (brighter to fainter) of the inner and outer doubles would then be 2.0 and 0.65, respectively, although the outer lobes are very similar in total flux.
3.2.3. J0901+4420
We discovered the source J0901+4420 in the LoTSS DR2 image. Its host has a prominent 9-mJy radio core in VLASS, but is very faint (r = 25.3) in the DESI DR10 image. The star Gaia 1009292060152667904 lies 3.2″ SE of the host, which confuses the WISE images. The only available zphot = 0.87 from Zhou et al. (2021) may be underestimated given the optical faintness of the object. Assuming a redshift z = 0.87, its angular size of 11.7′ would yield a lower limit to its LLS of 5.4 Mpc. The radio core is reported as slightly extended along PA ∼ 130° in VLASS (Gordon et al. 2021) and along PA ∼ 106° in the LoTSS DR2 catalogues (Shimwell et al. 2022). In contrast, it is listed in FIRST (Helfand et al. 2015) with a small extent along PA ∼ 12°, i.e. closer to the radio axis at PA ∼ 130° of the outer lobes. The core flux densities at 0.144, 1.4, and 3 GHz are 22, 14, and 25 mJy, respectively, which may indicate variability. Halfway to the southern lobe, the object DESI J135.3744+44.2967, r = 23.65, zphot ∼ 1.0 from Zhou et al. (2021), Beck et al. (2021), Duncan (2022) appears as a weak radio point source. We consider it an unlikely host for the entire source, given its asymmetric location. Along the northern lobe, the low surface brightness galaxy SDSS J090124.11+442214.2 appears as a superposed radio source.
3.2.4. J1108+2916
This GRG named J1108+2916 is listed by Hardcastle et al. (2023) with LLS = 5.7 Mpc. It has rather symmetric lobes, gradually increasing in radio surface brightness from the host to the outer hotspots. The only unusual feature is a smooth but significant bending toward the south, which occurs about 1.5′ before reaching the SW hotspot. We measured an LAS of 11.6′, obtaining an average photometric redshift of zphot = 1.05 from Zhou et al. (2021), Duncan (2022) and Zou et al. (2022). In contrast, SDSS DR12 (Alam et al. 2015) and Brescia et al. (2014) underestimate the redshift, with a value of ∼0.385. Two additional intermediate redshifts of 0.77 and 0.98 appear in Beck et al. (2021) and Beck et al. (2022), respectively. We adopted a conservative lower limit of zphot > 0.8 to estimate a lower limit for its LLS of 5.2 Mpc.
J1108+2916 is accompanied in the sky by two other RGs with almost parallel orientation, though clearly in the foreground of the large GRG, namely SDSS J110829.69+291736.8, zspec = 0.2147 and LLS = 0.28 Mpc located ∼1.4′ NW of the host, and 2MASX J11082297+2914281, zspec = 0.2123, and LLS = 0.45 Mpc, located ∼3.3′ SW of the host.
3.2.5. J1529+6015
This GRG was presented in Sect. 10.3 of Hardcastle et al. (2023) as having an LLS of 6.9 Mpc, albeit with some doubt about the correct host and host redshift. The exact LAS of the source is somewhat uncertain due to artefacts caused by a strong source hosted by SDSS J153004.29+602422.8 some 2.5′ north of the northern lobe of the GRG. We estimated LAS = 17.2′ from the LoTSS DR2 image. The most likely host is the galaxy SDSS J152932.16+601534.4 (marked with a magenta cross in our Fig. 4), for which Oei et al. (2024, who named this source ‘Porphyrion’) recently measured a redshift of zspec = 0.896, resulting in LLS = 6.16 Mpc. However, at an angular distance of 19″ NNE of this galaxy lies the radio-loud QSO SDSS J152933.03+601552.5 with zspec = 0.7984 from SDSS, and confirmed by Oei et al. (2024) with zspec = 0.799, which we assumed to be superposed on the northern arm of this GRG. If the QSO were the actual host of the GRG, its LLS would be 5.94 Mpc. It may be a restarted GRG, but in this case the inner double would be rather asymmetric, with the inner lobe of the NE ending in a very elongated radio ridge near declination +60° 16.5′ and a diffuse double hotspot near declination +60° 14.5′. Similarly to the southern lobe of J1108+2916, the southern lobe of J1529+6015 bends westward approximately 1′ before reaching the southern hotspot.
3.2.6. J1753−0332
This GRG is clearly seen in the RACS-low image at 888 MHz (McConnell et al. 2020), and a radio core in both RACS and VLASS confirms the host galaxy. Given its low Galactic latitude of +11.2° and r-band extinction of Ar = 1.7 mag, only a single photometric redshift of zphot = 0.62 ± 0.06 from Beck et al. (2021) was found. We have no reason to believe this to be an overestimation. Moreover, the presence of numerous faint, red galaxies within ∼30 arcsec of the host in the Pan-STARRs DR1 colour image (Flewelling et al. 2020), albeit without any zphot value in Beck et al. (2021), suggests the host is a member of a galaxy cluster lying in an area not covered by cluster catalogues.
3.3. Radio morphology and asymmetry
From a visual inspection of the shape of the radio emission in the best available survey images, we find that 25 per cent of our 142 GRGs show very diffuse lobes typical of remnant radio galaxies, only 59 per cent show indications of hotspots in at least one lobe, and only 38 per cent show a hotspot in both lobes. We classified the radio morphology of each lobe of our 142 GRGs according to their FR type (Fanaroff & Riley 1974) and found no single GRG that conforms to an FR I type on both sides, except possibly J1821+2639 from Oei et al. (2023a), which unfortunately lies outside the public LoTSS DR2 area, for which images are not available to us. Only nine GRGs show lobes that deviate from the FR II type and we describe these sources in the following.
J0235+3104 is a remnant-type double-lobed source with no indication of radio jets or hotspots.
J0331−7713 appears with a FR II type northern lobe and a very low surface brightness southern lobe, without indication of a hotspot.
J0740−6647 was recognised in RACS-low and displays symmetric, rectangular-shaped lobes with sharp edges on both sides along their major axes, plus faint radio emission beyond their radio brightness peak, the location of which formally remains consistent with an FR II type on both sides.
J0831+6711 has a hybrid morphology with its north-east arm resembling an FR I source and its south-west arm consistent with FR II type, albeit without evidence for a hotspot.
J1129+2733 was published by Oei et al. (2023a) but is not in the footprint of the public LoTSS DR2 release. Its NVSS image led Andernach et al. (2012) (bottom right figure) to propose it as a candidate GRG. The RACS-low survey image (Hale et al. 2021) barely reveals the outer lobes, but suggests an inner double of 2.5′. However, VLASS shows this to be just the inner part of the jets, with no indication of inner hotspots; therefore, we do not consider it a restarted RG.
1530+5243 in LoTSS DR2 has a diffuse northern lobe without a hotspot and is formally of type FR I, while the southern lobe consists almost entirely of a hotspot, with low surface brightness emission only marginally detected even in the low-resolution LoTSS image.
J1558−2138 appears as a remnant-type double-lobed source already in NVSS, and in RACS-mid (Duchesne et al. 2023) and MeerKAT (Sejake et al. 2023) shows a complex and bent radio structure, reminiscent of a wide-angle tailed (WAT) source without indications of jets or hotspots.
J1651+3209 is a rather straight FR II RG with a wide inner double of 4.9′ extent (or 66 per cent of its total size), ending in hotspots, while the outer lobes are of hybrid morphology, with the north-west and south-west arms of type FR II and I, respectively.
Finally, 1902−5605, recognised in RACS-low and measured by us in the EMU main survey, exhibits a faint jet due north-west, ending in a diffuse lobe of constant surface brightness without a hotspot. The south-east lobe begins with a radio knot ∼1.5′ from the host and ends in a diffuse emission region, formally of FR II type, but without a hotspot.
Next, we discuss the asymmetry of the lobes of GRGs in our sample. Asymmetry in RGs can be produced by three effects: (i) the jet production at the AGN could already be asymmetric; (ii) orientation can cause asymmetry owing to the differing light travel times to the observer for each arm; and (iii) the external medium could be anisotropic presenting different resistance to the jets. Based on the observation that most sources show the stronger lobe on the shorter arm, Lara et al. (2004) concluded that the ambient medium is the dominant cause of asymmetry in their sample of RGs.
The arm-length ratio (ALR), sometimes denoted as r, of a radio source is typically defined as the ratio of the length of its shorter to its longer arm. A value of r near unity indicates a more symmetric jet ejection and propagation environment. Lara et al. (2004) found a clear difference between the r distribution of FR I and FR II RGs. For FR I types, the distribution gradually increases towards symmetry (r = 1), with 50 per cent of the sources presenting r > 0.8, while for FR II types the distribution is more concentrated around a mean value of 0.78. They also examined the asymmetry of GRGs. Comparing the arm-length ratio of the GRGs of FR II type with normal FR II, they did not find that GRGs are more asymmetric than smaller RGs, while Schoenmakers et al. (2000) noted that GRG asymmetries are slightly larger than those of smaller-sized RGs from the 3CR catalogue. Here, we define the ALR as the length of the brighter lobe divided by the length of the fainter lobe. Thus, an ALR > 1 implies that the longer lobe is brighter, while ALR < 1 indicates that the shorter lobe is brighter. This definition makes the ALR more informative than the ratio r described above. In Fig. 5 we plot the ALR for 139 of our 142 GRGs and find a distribution peaking at values below 1, around 0.85. This is similar to the distribution of a much larger sample of smaller FR II sources drawn from the FIRST survey (see Fig. 4 in de la Rosa Valdés & Andernach 2019).
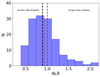 |
Fig. 5. Ratio of stronger-to-fainter lobe length for 139 of our 142 GRGs. An ALR > 1 implies that the longer lobe is brighter, while ALR < 1 implies that the shorter lobe is brighter. The vertical red line at ALR = 1 is shown to guide the eye. The black line denotes the median at 0.89. |
When the lobe interacts with a denser environment, the jet head performs more work, leading to a more efficient conversion of jet energy into radio emission (Eilek & Shore 1989; Blundell et al. 1999). The side of the jet that propagates through a denser ambient medium tends to be shorter and may appear brighter than the other side. Hence, jets with ALR < 1 provide evidence of an anisotropic environment. Arshakian & Longair (2000) found that asymmetry is more common in luminous sources. However, in our GRG sample, we find no relation between radio power and ALR. In a related study, Dabhade et al. (2025) found that cocoons in which the inner lobes of giant double-double RGs expand often contain dense material, causing an asymmetry of the inner lobes.
3.4. Association with galaxy clusters
In this section, we investigate the possible association of the GRGs in our sample with known galaxy clusters drawn from the deepest large-scale optical surveys such as the Sloan Digital Sky Survey (SDSS, Hao et al. 2010; Szabo et al. 2011; Wen & Han 2015), the Dark Energy Survey (DES DR2, Zou et al. 2022), the Dark Energy Survey Instrument Legacy Survey (DESI, Yang et al. 2021; Zou et al. 2021) based on DR8 (Yantovski-Barth et al. 2024; Zou et al. 2022, based on DESI DR9) and Wen & Han 2024 (based on DESI DR10), and the very deep Hyper Suprime-Cam Subaru Strategic Program (HSC-SSP, Oguri et al. 2018; Zou et al. 2022). Of our 142 GRGs, 82 fall within the SDSS survey footprint, 20 fall within the DES DR2 region (Zou et al. 2022), 126 fall within DESI DR10, and only four fall within the HSC-SSP wide survey. Most of these catalogues list the position of the brightest cluster galaxy (BrClG) as the cluster centre, and some also provide a list of individual cluster member galaxies, which justifies a cross-match of our GRG host positions within a 2″ search radius. There is another cluster catalogue by Yang et al. (2021), based on DESI DR8, which lists the number of members of each galaxy system, including those with a single ‘member’ galaxy, i.e. an isolated galaxy. A cross-match within 1 Mpc projected distance on the sky plane from any of the 133,036 clusters in MaDCoWS2 DR2 (Thongkham et al. 2024) did not yield any cluster association for the 47 GRGs in our sample covered by this catalogue. For several other large cluster catalogues (including some based on X-ray or Sunyaev–Zel’dovich effect detections) that do not list the BrClG position as the cluster centre, we used a wider match radius, but no further cluster associations were found. In the last column of Table A.1 we indicate whether we found a GRG host as a BrClG (b), a member galaxy (m), or isolated (i) in any of these catalogues. We note that 16 of the 18 cluster-associated hosts are listed as BrClG and only two additional ones as cluster members. One of our GRG hosts is listed as ‘bm’, i.e. both a BrClG and a non-brightest cluster member in different catalogues, two others are listed as ‘mi’, meaning both a cluster member and an isolated galaxy, and three further GRGs are even listed as ‘bi’, i.e. both a BrClG and an isolated galaxy. We interpret this as a consequence of the different clustering algorithms used by various authors and conclude that cluster association fractions of GRG hosts should be treated with caution.
To estimate the fraction of GRGs associated with clusters, we must take into account the typical redshift limits of the respective cluster catalogues. The most distant GRGs with BrClG or cluster member matches are found near z ∼ 0.85, and the most distant isolated GRG host galaxy from Yang et al. (2021) is at z ∼ 0.9. We therefore consider this redshift as the upper limit beyond which we can expect to find cluster associations for our GRG hosts. Of our 142 GRGs, 25 have z ≥ 0.9, three of which lie at Galactic latitude |b|≤20°, leaving 124-22 = 102 of the 142 GRGs that may have been detected as cluster members in DESI DR10 by Wen & Han (2024). We therefore conclude that at least 16 out of 102 (or 16 per cent) of our GRGs are cluster members, and all except two are listed as BrClGs, including four GRGs with LLS > 4 Mpc. While this is a similar percentage as for the smaller GRGs (Dabhade et al. 2020b; Andernach et al. 2021), it contrasts with Sankhyayan & Dabhade (2024) who suggest that GRGs larger than ∼3 Mpc are not associated with clusters. This discrepancy may result from the smaller sample of GRGs used by these authors. Besides the cluster-associated GRGs, 28 of the 102 GRGs with z < 0.9 appear isolated in the cluster catalogue of Yang et al. (2021), leaving more than half of our GRGs without clear evidence of lying in either over- or underdense regions. Deeper optical surveys are needed for the detection of galaxy clusters up to redshifts beyond ∼1.
Thus, we show that at least 16 per cent of the GRGs are located in currently catalogued galaxy clusters. Hence, their sizes cannot be attributed to an underdense environment but possibly to higher jet power, which in turn may result from more efficient feeding of the central black hole of the host galaxies.
3.5. Bending angles
In this section we study the bending angles (B.A.) which we measured using the best available survey images, with the dist option in the Aladin software, by connecting the host galaxy positions to the brightest pixels in the lobes of the GRGs. The B.A. is defined as the deviation from a parallel lobe orientation.
As shown in Fig. 6, the B.A. decreases with LLS, where the median B.A. of the 108 GRGs with LLS between 3 and 4 Mpc is 3.0°, while the median B.A. of the 31 GRGs with LLS larger than 4 Mpc is only 1.4°. We divided the sample into equal groups of 70 GRGs at LLS = 3.39 Mpc, finding a median B.A. of 3.0° for the smaller GRGs and a median B.A. of 2.8° for the larger ones. A Student’s t-test yields a p-value of 0.186, and the KS test gives a p-value of 0.88, suggesting that both samples belong to the same distribution.
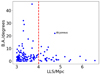 |
Fig. 6. Bending angle (B.A.) measured in degrees, for 139 of our 142 GRGs, plotted against the largest linear size, measured in Mpc. The location of GRG J0814+5224 (Alcyoneus) in this plot is labelled (Oei et al. 2022). The vertical line separates the sample into GRGs with LLS < 4 Mpc and > 4 Mpc. Their median LLS is 3.4 Mpc. |
None of the additional statistical tests performed suggest a significant difference in the B.A. distributions of GRGs with LLS between 3 and 4 Mpc and those with LLS larger than 4 Mpc (e.g. p = 0.62 for a KS test). The apparent absence of B.A.s larger than ∼10° for GRGs > 4 Mpc may result from the small number of such large GRGs. We find no significant trend of B.A. with redshift in our sample.
Comparing the 17 GRG hosts listed as BrClGs (including the two also listed as non-brightest cluster members) with the 27 isolated hosts, we find that the B.A. distribution shows a notable difference. The B.A. tends to be larger for GRGs in clusters where higher ambient gas densities are expected to have a larger effect on radio lobes. The median B.A. in clusters is 3.5°, while for the 22 isolated GRGs, it is 2.0°. The student’s t-test yields p = 0.033, but a KS test returns p = 0.25, suggesting that this difference is statistically insignificant. As the KS test does not assume normality of the underlying distribution, it evaluates differences beyond the mean and may be more applicable here. Moreover, we find no statistically significant differences in the ALR between cluster-associated and isolated galaxies. The median ALR for the 17 cluster-associated GRGs is 0.84 and 0.945 for the 27 isolated GRGs. The KS test yields a p-value of 0.27, suggesting that the two samples are likely drawn from the same distribution.
4. Discussion and conclusions
Our large collection of extremely large GRGs exhibits remarkable features. In particular, their energetics and highly linear morphology raise several questions. Jets with lengths of approximately 3 Mpc can inject energy into the surrounding medium comparable to that released during galaxy cluster mergers (Oei et al. 2024), making them among the most energetic events since the big bang. The radio powers of our GRGs exceed the top range shown in Fig. 8 of Hardcastle et al. (2025), indicating total powers in excess of 1040 W. Sustaining this power for 100 Myr, would yield a total energy of > 1062 erg.
This leads to a conundrum: to power such jets, the supermassive black hole must grow by a large fraction (e.g. by an estimated ∼109 M⊙ in the case of J1529+6015, also known as Porphyrion). The accretion of such masses is usually associated with the accretion of substructures that induce velocity dispersion in the collisional and collisionless matter. Yet, the lobes of GRGs remain surprisingly straight.
The straightness of the lobes suggests low peculiar velocities (vp < 102 km/s), which may be interpreted as the hosts being at the bottom of a local gravitational potential well, perhaps surrounded by a void. This explains both the large LLS and the persistent collimation of the lobes as the jets become more resistant to Kelvin–Helmholtz instabilities as the ambient density decreases (Perucho 2019). Around 16 per cent of the GRGs are located in clusters and are preferentially hosted by the brightest cluster galaxies, which often reside at the bottom of gravitational wells where the intracluster medium is densest. However, clusters are dynamic environments, and it is unclear how AGN feedback can operate efficiently if the AGN at the centre of the cluster is a GRG that no longer participates in heating the cluster core. To date, no simulations have explored jets of this length, and we hope that our sample motivates numerical studies in this area.
Assuming that the intrinsic LLS follow a Pareto distribution, Oei et al. (2023a) modelled projection and selection effects. They found that LLS were well described by a Pareto distribution with a tail index of −3.5 ± 0.5. This implies that, given its projected length, a GRG’s intrinsic length is expected to be, on average, just 15 per cent larger. We fitted a Pareto distribution to our LLS distribution and found a higher tail index of −4.4, although the fit is not particularly good. In Fig. 7, we show the number of GRGs larger than a given LLS from this work (in blue for LLS > 3 Mpc), along with smaller GRGs (in grey) from the compilation by Mostert et al. (2024). The discontinuity between blue and grey points at 3 Mpc reflects our identification of additional GRGs in this size range, while the deficit of blue points at LLS > 5.5 Mpc arises from our exclusion of several GRGs listed in Mostert et al. (2024). The number of GRGs with LLS > 3 Mpc declines sharply, with slopes of −6 or steeper. This suggests that such extended GRGs are very rare.
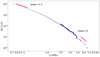 |
Fig. 7. The number of known GRGs larger than a given LLS as function of LLS. Blue dots represent the 142 GRGs > 3 Mpc from this publication, and grey dots represent those from Mostert et al. (2024). Lines of fixed slope in this log-log plot are shown for reference. |
Approximately 19 (or 13 per cent) of the GRGs with LLS > 3 Mpc lie at z ≥ 1, although only three of these are spectroscopic (the remainder typically have consistent photometric redshifts from more than one reference), raising the question of how such sources could reach these sizes with the conditions in the early Universe (matter density, CMB photon density) or be detected given cosmological surface brightness dimming. For example, the QSO SDSS J004131.75+291217.6 hosts a 6.4′-wide FR II with diffuse lobes and has a spectroscopic redshift of z = 1.25, yielding a factor of (1 + z)4 ≈ 25 for the expected surface brightness dimming. Most record-length outflows, such as those in 3C 236 (LLS = 4.6 Mpc), J1420−0545 (LLS = 4.84 Mpc), and J0814+5224 (Alcyoneus, LLS = 5.0 Mpc), are powered by radiatively inefficient AGN.
Recently, Neronov et al. (2025) inferred the magnetic field in the jets of Porphyrion GRG. Based on the absence of gamma-ray emission, they determine a lower limit for the co-moving magnetic field strength of approximately 10 nG. This is consistent with recent estimates of magnetic fields within the filaments of the cosmic web. They also explore the hypothesis that Porphyrion may result from a very-high-energy gamma-ray beam from an AGN. In this scenario, jets can maintain a straight appearance over vast distances without spreading into voids.
The role of GRGs in magnetising the ambient medium has been widely discussed (Oei et al. 2024). In particular, it remains unclear what fraction of the jets’ non-thermal components can diffuse into the voids, potentially leading to wide-scale magnetisation. However, the persistent collimation of the jets may limit diffusion of magnetic fields into the ambient medium.
The main conclusions of this paper are:
-
The median redshift, median radio power, and quasar fraction in our sample of 142 GRGs larger than 3 Mpc in projection are not significantly different from those of the general sample of GRGs.
-
None of our GRGs larger than 3 Mpc, with one possibly exception, can be classified as a clear FR I-type source, and only 6 per cent deviate from a FR II radio morphology in both lobes. However, only 59 per cent show indications of a hotspot in at least one lobe, and 38 per cent show a hotspot in both lobes. About 25 per cent of our GRGs exhibit very diffuse lobes typical of remnant radio galaxies.
-
We find only marginal evidence that the B.A. decreases with LLS, and no discernible dependence on redshift.
-
As in smaller radio galaxies, the shorter lobe is most often also the brighter one.
-
The most powerful GRGs in our sample are difficult to reconcile with radio galaxy evolution models.
-
The fraction of GRGs > 3 Mpc associated with catalogued clusters of galaxies is at least 16 per cent and thus indistinguishable from that of smaller GRGs. We find no evidence that the percentage of GRGs associated with clusters decreases with increasing projected radio size.
-
The bending angles of GRGs > 3 Mpc in known clusters are larger than for GRGs that are not associated with clusters.
Acknowledgments
HA is grateful to Hamburger Sternwarte, where part of this research was finalized, for their hospitality and financial support. MB acknowledges funding by the Deutsche Forschungsgemeinschaft (DFG) under Germany’s Excellence Strategy – EXC 2121 “Quantum Universe” – 390833306 and the DFG Research Group “Relativistic Jets”. We are grateful to E.F. Jiménez Andrade, R.F. Maldonado Sánchez, A. Rodríguez Yáñez, L. Rudnick, I.d.C. Santiago Bautista for having found some of the GRGs, and to A. Offringa and C. Lynch for providing images in which some GRGs were found. GTC spectra for 5 of the GRGs were reduced by I. Plauchu-Frayn and R. Coziol. This research has made use of the “Aladin sky atlas” developed at CDS, Strasbourg Observatory, France. We also acknowledge the use of the CIRADA cutout service (cutouts.cirada.ca), operated by the Canadian Initiative for Radio Astronomy Data Analysis (CIRADA). CIRADA is funded by a grant from the Canada Foundation for Innovation 2017 Innovation Fund (Project 35999), as well as by the Provinces of Ontario, British Columbia, Alberta, Manitoba and Quebec, in collaboration with the National Research Council of Canada, the US National Radio Astronomy Observatory and Australia’s Commonwealth Scientific and Industrial Research Organisation. This paper is based (in part) on data obtained with the International LOFAR Telescope (ILT) under project code LT10_012. LOFAR (van Haarlem et al. 2013) is the Low Frequency Array designed and constructed by ASTRON. It has observing, data processing, and data storage facilities in several countries, which are owned by various parties (each with their own funding sources), and which are collectively operated by the ILT foundation under a joint scientific policy. The ILT resources have benefited from the following recent major funding sources: CNRS-INSU, Observatoire de Paris and Université d’Orléans, France; BMBF, MIWF-NRW, MPG, Germany; Science Foundation Ireland (SFI), Department of Business, Enterprise and Innovation (DBEI), Ireland; NWO, The Netherlands; The Science and Technology Facilities Council, UK; Ministry of Science and Higher Education, Poland[7]. Funding for the Sloan Digital Sky Survey V has been provided by the Alfred P. Sloan Foundation, the Heising-Simons Foundation, the National Science Foundation, and the Participating Institutions. SDSS acknowledges support and resources from the Center for High-Performance Computing at the University of Utah. SDSS telescopes are located at Apache Point Observatory, funded by the Astrophysical Research Consortium and operated by New Mexico State University, and at Las Campanas Observatory, operated by the Carnegie Institution for Science. The Pan-STARRS1 Surveys (PS1) and the PS1 public science archive have been made possible through contributions by the Institute for Astronomy, the University of Hawaii, the Pan-STARRS Project Office, the Max-Planck Society and its participating institutes, the Max Planck Institute for Astronomy, Heidelberg and the Max Planck Institute for Extraterrestrial Physics, Garching, The Johns Hopkins University, Durham University, the University of Edinburgh, the Queen’s University Belfast, the Harvard-Smithsonian Center for Astrophysics, the Las Cumbres Observatory Global Telescope Network Incorporated, the National Central University of Taiwan, the Space Telescope Science Institute, the National Aeronautics and Space Administration under Grant No. NNX08AR22G issued through the Planetary Science Division of the NASA Science Mission Directorate, the National Science Foundation Grant No. AST-1238877, the University of Maryland, Eotvos Lorand University (ELTE), the Los Alamos National Laboratory, and the Gordon and Betty Moore Foundation.
References
- Ahumada, R., Allende Prieto, C., Almeida, A., et al. 2020, ApJS, 249, 3 [NASA ADS] [CrossRef] [Google Scholar]
- Alam, S., Albareti, F. D., Allende Prieto, C., et al. 2015, ApJS, 219, 12 [Google Scholar]
- Andernach, H., Jiménez Andrade, E. F., Maldonado Sánchez, R. F., Vásquez Báez, I. R., et al. 2012, Science from the Next Generation Imaging and Spectroscopic Surveys, P1 [Google Scholar]
- Andernach, H., Jiménez-Andrade, E. F., & Willis, A. G. 2021, Galaxies, 9, 99 [NASA ADS] [CrossRef] [Google Scholar]
- Arshakian, T. G., & Longair, M. S. 2000, MNRAS, 311, 846 [NASA ADS] [CrossRef] [Google Scholar]
- Baldwin, J. E. 1982, in Extragalactic Radio Sources, eds. D. S. Heeschen, & C. M. Wade, 97, 21 [NASA ADS] [Google Scholar]
- Banfield, J. K., Wong, O. I., Willett, K. W., et al. 2015, MNRAS, 453, 2326 [Google Scholar]
- Barthel, P. D., Schilizzi, R. T., Miley, G. K., Jägers, W. J., & Strom, R. G. 1985, A&A, 148, 243 [Google Scholar]
- Bassani, L., Ursini, F., Malizia, A., et al. 2021, MNRAS, 500, 3111 [Google Scholar]
- Beck, R., Szapudi, I., Flewelling, H., et al. 2021, MNRAS, 500, 1633 [Google Scholar]
- Beck, R., Dodds, S. C., & Szapudi, I. 2022, MNRAS, 515, 4711 [NASA ADS] [CrossRef] [Google Scholar]
- Becker, R. H., White, R. L., & Helfand, D. J. 1995, ApJ, 450, 559 [Google Scholar]
- Blundell, K. M., Rawlings, S., & Willott, C. J. 1999, AJ, 117, 677 [Google Scholar]
- Bondi, M., Scaramella, R., Zamorani, G., et al. 2024, A&A, 683, A179 [NASA ADS] [CrossRef] [EDP Sciences] [Google Scholar]
- Bonnarel, F., Fernique, P., Bienaymé, O., et al. 2000, A&AS, 143, 33 [NASA ADS] [CrossRef] [EDP Sciences] [Google Scholar]
- Brescia, M., Cavuoti, S., Longo, G., & De Stefano, V. 2014, A&A, 568, A126 [NASA ADS] [CrossRef] [EDP Sciences] [Google Scholar]
- Brüggen, M., Reiprich, T. H., Bulbul, E., et al. 2021, A&A, 647, A3 [NASA ADS] [CrossRef] [EDP Sciences] [Google Scholar]
- Condon, J. J., Cotton, W. D., Greisen, E. W., et al. 1998, AJ, 115, 1693 [Google Scholar]
- Dabhade, P., Gaikwad, M., Bagchi, J., et al. 2017, MNRAS, 469, 2886 [NASA ADS] [CrossRef] [Google Scholar]
- Dabhade, P., Mahato, M., Bagchi, J., et al. 2020a, A&A, 642, A153 [NASA ADS] [CrossRef] [EDP Sciences] [Google Scholar]
- Dabhade, P., Röttgering, H. J. A., Bagchi, J., et al. 2020b, A&A, 635, A5 [NASA ADS] [CrossRef] [EDP Sciences] [Google Scholar]
- Dabhade, P., Saikia, D. J., & Mahato, M. 2023, J. Astrophys. Astron., 44, 13 [NASA ADS] [CrossRef] [Google Scholar]
- Dabhade, P., Chavan, K., Saikia, D. J., Oei, M. S. S. L., & Röttgering, H. J. A. 2025, A&A, 696, A97 [NASA ADS] [CrossRef] [EDP Sciences] [Google Scholar]
- de la Rosa Valdés, P. A., & Andernach, H. 2019, arXiv e-prints [arXiv:1908.09988] [Google Scholar]
- Debski, M. H., Zeimann, G. R., Hill, G. J., et al. 2025, ApJ, 978, 101 [Google Scholar]
- Delhaize, J., Heywood, I., Prescott, M., et al. 2021, MNRAS, 501, 3833 [Google Scholar]
- DESI Collaboration (Abdul-Karim, M., et al.) 2025, AJ, submitted [arXiv:2503.14745] [Google Scholar]
- Duchesne, S. W., Thomson, A. J. M., Pritchard, J., et al. 2023, PASA, 40, e034 [NASA ADS] [CrossRef] [Google Scholar]
- Duncan, K. J. 2022, MNRAS, 512, 3662 [NASA ADS] [CrossRef] [Google Scholar]
- Edler, H. W., de Gasperin, F., Shimwell, T. W., et al. 2023, A&A, 676, A24 [NASA ADS] [CrossRef] [EDP Sciences] [Google Scholar]
- Eilek, J. A., & Shore, S. N. 1989, ApJ, 342, 187 [Google Scholar]
- Fanaroff, B. L., & Riley, J. M. 1974, MNRAS, 167, 31P [Google Scholar]
- Flewelling, H. A., Magnier, E. A., Chambers, K. C., et al. 2020, ApJS, 251, 7 [NASA ADS] [CrossRef] [Google Scholar]
- Gordon, Y. A., Boyce, M. M., O’Dea, C. P., et al. 2021, ApJS, 255, 30 [NASA ADS] [CrossRef] [Google Scholar]
- Gürkan, G., Prandoni, I., O’Brien, A., et al. 2022, MNRAS, 512, 6104 [CrossRef] [Google Scholar]
- Hale, C. L., McConnell, D., Thomson, A. J. M., et al. 2021, PASA, 38, e058 [NASA ADS] [CrossRef] [Google Scholar]
- Hao, J., McKay, T. A., Koester, B. P., et al. 2010, ApJS, 191, 254 [Google Scholar]
- Hardcastle, M. J. 2018, MNRAS, 475, 2768 [Google Scholar]
- Hardcastle, M. J., Horton, M. A., Williams, W. L., et al. 2023, A&A, 678, A151 [NASA ADS] [CrossRef] [EDP Sciences] [Google Scholar]
- Hardcastle, M. J., Pierce, J. C. S., Duncan, K. J., et al. 2025, MNRAS, in press [arXiv:2504.09303] [Google Scholar]
- Helfand, D. J., White, R. L., & Becker, R. H. 2015, ApJ, 801, 26 [NASA ADS] [CrossRef] [Google Scholar]
- Hopkins, A. M., Kapinska, A., Marvil, J., et al. 2025, ArXiv e-prints [arXiv:2505.08271] [Google Scholar]
- Hurley-Walker, N., Callingham, J. R., Hancock, P. J., et al. 2017, MNRAS, 464, 1146 [Google Scholar]
- Hurley-Walker, N., Galvin, T. J., Duchesne, S. W., et al. 2022, PASA, 39, e035 [NASA ADS] [CrossRef] [Google Scholar]
- Intema, H. T., Jagannathan, P., Mooley, K. P., & Frail, D. A. 2017, A&A, 598, A78 [NASA ADS] [CrossRef] [EDP Sciences] [Google Scholar]
- Ishwara-Chandra, C. H., & Saikia, D. J. 1999, MNRAS, 309, 100 [NASA ADS] [CrossRef] [Google Scholar]
- Itoh, R., Utsumi, Y., Inoue, Y., et al. 2020, ApJ, 901, 3 [NASA ADS] [CrossRef] [Google Scholar]
- Knowles, K., Cotton, W. D., Rudnick, L., et al. 2022, A&A, 657, A56 [NASA ADS] [CrossRef] [EDP Sciences] [Google Scholar]
- Komberg, B. V., & Pashchenko, I. N. 2009, Astron. Rep., 53, 1086 [NASA ADS] [CrossRef] [Google Scholar]
- Koribalski, B. S. 2025, PASA, submitted [arXiv:2504.07314] [Google Scholar]
- Krogager, J. K., Gupta, N., Noterdaeme, P., et al. 2018, ApJS, 235, 10 [Google Scholar]
- Kronberg, P. P., Wielebinski, R., & Graham, D. A. 1986, A&A, 169, 63 [NASA ADS] [Google Scholar]
- Kuźmicz, A., & Jamrozy, M. 2012, MNRAS, 426, 851 [CrossRef] [Google Scholar]
- Kuźmicz, A., & Jamrozy, M. 2021, ApJS, 253, 25 [CrossRef] [Google Scholar]
- Kuźmicz, A., Jamrozy, M., Bronarska, K., Janda-Boczar, K., & Saikia, D. J. 2018, ApJS, 238, 9 [Google Scholar]
- Lacy, M., Baum, S. A., Chandler, C. J., et al. 2020, PASP, 132, 035001 [Google Scholar]
- Lan, T.-W., & Prochaska, X. J. 2021, MNRAS, 502, 5104 [NASA ADS] [CrossRef] [Google Scholar]
- Lara, L., Márquez, I., Cotton, W. D., et al. 2001, A&A, 378, 826 [NASA ADS] [CrossRef] [EDP Sciences] [Google Scholar]
- Lara, L., Giovannini, G., Cotton, W. D., et al. 2004, A&A, 421, 899 [NASA ADS] [CrossRef] [EDP Sciences] [Google Scholar]
- Lynch, C. R., Galvin, T. J., Line, J. L. B., et al. 2021, PASA, 38, e057 [Google Scholar]
- Machalski, J., Jamrozy, M., & Zola, S. 2001, A&A, 371, 445 [NASA ADS] [CrossRef] [EDP Sciences] [Google Scholar]
- Machalski, J., Chyzy, K. T., & Jamrozy, M. 2004, Acta Astron., 54, 391 [NASA ADS] [Google Scholar]
- Mahato, M., Dabhade, P., Saikia, D. J., et al. 2022, A&A, 660, A59 [NASA ADS] [CrossRef] [EDP Sciences] [Google Scholar]
- Mauch, T., Murphy, T., Buttery, H. J., et al. 2003, MNRAS, 342, 1117 [Google Scholar]
- McConnell, D., Hale, C. L., Lenc, E., et al. 2020, PASA, 37, e048 [Google Scholar]
- Mostert, R. I. J., Morganti, R., Brienza, M., et al. 2023, A&A, 674, A208 [NASA ADS] [CrossRef] [EDP Sciences] [Google Scholar]
- Mostert, R. I. J., Oei, M. S. S. L., Barkus, B., et al. 2024, A&A, 691, A185 [NASA ADS] [CrossRef] [EDP Sciences] [Google Scholar]
- Neronov, A., Vazza, F., Brandenburg, A., & Caprini, C. 2025, A&A, 696, L8 [NASA ADS] [CrossRef] [EDP Sciences] [Google Scholar]
- Norris, R. P., Marvil, J., Collier, J. D., et al. 2021, PASA, 38, e046 [NASA ADS] [CrossRef] [Google Scholar]
- Oei, M. S. S. L., van Weeren, R. J., Hardcastle, M. J., et al. 2022, A&A, 660, A2 [NASA ADS] [CrossRef] [EDP Sciences] [Google Scholar]
- Oei, M. S. S. L., van Weeren, R. J., Gast, A. R. D. J. G. I. B., et al. 2023a, A&A, 672, A163 [NASA ADS] [CrossRef] [EDP Sciences] [Google Scholar]
- Oei, M. S. S. L., van Weeren, R. J., Hardcastle, M. J., et al. 2023b, MNRAS, 518, 240 [Google Scholar]
- Oei, M. S. S. L., Hardcastle, M. J., Timmerman, R., et al. 2024, Nature, 633, 537 [NASA ADS] [CrossRef] [Google Scholar]
- Offringa, A. R., Trott, C. M., Hurley-Walker, N., et al. 2016, MNRAS, 458, 1057 [Google Scholar]
- Oguri, M., Lin, Y.-T., Lin, S.-C., et al. 2018, PASJ, 70, S20 [NASA ADS] [Google Scholar]
- O’Sullivan, S. P., Shimwell, T. W., Hardcastle, M. J., et al. 2023, MNRAS, 519, 5723 [CrossRef] [Google Scholar]
- Perucho, M. 2019, Galaxies, 7, 70 [Google Scholar]
- Quici, B., Turner, R. J., Seymour, N., & Hurley-Walker, N. 2025, MNRAS, 537, 343 [Google Scholar]
- Rengelink, R. B., Tang, Y., de Bruyn, A. G., et al. 1997, A&AS, 124, 259 [NASA ADS] [CrossRef] [EDP Sciences] [Google Scholar]
- Sankhyayan, S., & Dabhade, P. 2024, A&A, 687, L8 [NASA ADS] [CrossRef] [EDP Sciences] [Google Scholar]
- Saripalli, L., Hunstead, R. W., Subrahmanyan, R., & Boyce, E. 2005, AJ, 130, 896 [Google Scholar]
- Schoenmakers, A. P., Mack, K. H., de Bruyn, A. G., et al. 2000, A&AS, 146, 293 [NASA ADS] [CrossRef] [EDP Sciences] [Google Scholar]
- Schoenmakers, A. P., de Bruyn, A. G., Röttgering, H. J. A., & van der Laan, H. 2001, A&A, 374, 861 [NASA ADS] [CrossRef] [EDP Sciences] [Google Scholar]
- Sejake, P. K., White, S. V., Heywood, I., et al. 2023, MNRAS, 518, 4290 [Google Scholar]
- Shimwell, T. W., Tasse, C., Hardcastle, M. J., et al. 2019, A&A, 622, A1 [NASA ADS] [CrossRef] [EDP Sciences] [Google Scholar]
- Shimwell, T. W., Hardcastle, M. J., Tasse, C., et al. 2022, A&A, 659, A1 [NASA ADS] [CrossRef] [EDP Sciences] [Google Scholar]
- Simonte, M., Andernach, H., Brüggen, M., Best, P. N., & Osinga, E. 2023, A&A, 672, A178 [NASA ADS] [CrossRef] [EDP Sciences] [Google Scholar]
- Simonte, M., Andernach, H., Brüggen, M., Miley, G. K., & Barthel, P. 2024, A&A, 686, A21 [NASA ADS] [CrossRef] [EDP Sciences] [Google Scholar]
- Simonte, M., Andernach, H., Brüggen, M., et al. 2022, MNRAS, 515, 2032 [CrossRef] [Google Scholar]
- Szabo, T., Pierpaoli, E., Dong, F., Pipino, A., & Gunn, J. 2011, ApJ, 736, 21 [NASA ADS] [CrossRef] [Google Scholar]
- Thongkham, K., Gonzalez, A. H., Brodwin, M., et al. 2024, ApJ, 976, 186 [Google Scholar]
- Turner, R. J., & Shabala, S. S. 2015, ApJ, 806, 59 [Google Scholar]
- Turner, R. J., Yates-Jones, P. M., Shabala, S. S., Quici, B., & Stewart, G. S. C. 2023, MNRAS, 518, 945 [Google Scholar]
- van Haarlem, M. P., Wise, M. W., Gunst, A. W., et al. 2013, A&A, 556, A2 [NASA ADS] [CrossRef] [EDP Sciences] [Google Scholar]
- Villarreal Hernández, A. C., & Andernach, H. 2018, arXiv e-prints [arXiv:1808.07178] [Google Scholar]
- Wagenveld, J. D., Klöckner, H. R., Gupta, N., et al. 2024, A&A, 690, A163 [NASA ADS] [CrossRef] [EDP Sciences] [Google Scholar]
- Wen, Z. L., & Han, J. L. 2015, ApJ, 807, 178 [Google Scholar]
- Wen, Z. L., & Han, J. L. 2024, ApJS, 272, 39 [NASA ADS] [CrossRef] [Google Scholar]
- White, R. L., Long, K. S., Becker, R. H., et al. 2019, ApJS, 241, 37 [NASA ADS] [CrossRef] [Google Scholar]
- Willis, A. G., Strom, R. G., & Wilson, A. S. 1974, Nature, 250, 625 [Google Scholar]
- Wong, O. I., Garon, A. F., Alger, M. J., et al. 2025, MNRAS, 536, 3488 [Google Scholar]
- Yang, X., Xu, H., He, M., et al. 2021, ApJ, 909, 143 [NASA ADS] [CrossRef] [Google Scholar]
- Yantovski-Barth, M. J., Newman, J. A., Dey, B., et al. 2024, MNRAS, 531, 2285 [NASA ADS] [CrossRef] [Google Scholar]
- Zhou, R., Newman, J. A., Mao, Y.-Y., et al. 2021, MNRAS, 501, 3309 [NASA ADS] [CrossRef] [Google Scholar]
- Zhou, X., Li, N., Zou, H., et al. 2025, MNRAS, 536, 2260 [Google Scholar]
- Zou, H., Gao, J., Xu, X., et al. 2021, ApJS, 253, 56 [NASA ADS] [CrossRef] [Google Scholar]
- Zou, H., Sui, J., Xue, S., et al. 2022, Res. Astron. Astrophys., 22, 065001 [Google Scholar]
Appendix A: Tables
Sample of 142 GRGs, sorted by increasing right ascension.
All Tables
All Figures
|
Fig. 1. Provenance of GRGs larger than 3 Mpc. Counterclockwise from the top, the categories are as follows: LOFAR publ.: GRGs found and published from LoTSS (Dabhade et al. 2020b; Oei et al. 2023a; Mostert et al. 2023), LoTSS Deep (Simonte et al. 2024; Bondi et al. 2024), and LoTSS DR2 new, which refers to our own discoveries from LoTSS DR2 images; the National Radio Astronomy Observatory (NRAO) VLA Sky Survey (NVSS, Condon et al. 1998) and Faint Images of the Radio Sky at Twenty-cm (FIRST, Becker et al. 1995),; recent surveys with the Australian Square Kilometre Array Pathfinder (ASKAP, McConnell et al. 2020; Norris et al. 2021); the Sydney University Molonglo Sky Survey (SUMSS, Mauch et al. 2003); the Murchison Widefield Array surveys (MWA, Offringa et al. 2016; Hurley-Walker et al. 2017, 2022; Lynch et al. 2021); the Westerbork Northern Sky Survey (WENSS, Rengelink et al. 1997), obtained with the Westerbork Synthesis Radio Telescope (WSRT); and the MeerKAT MALS DR2 (Wagenveld et al. 2024). |
| In the text | |
|
Fig. 2. Sky distribution of our sample in equatorial coordinates, with the same colour coding as in Fig. 1. |
| In the text | |
|
Fig. 3. Power–size diagram for 139 of our 142 GRGs. The logarithm of the radio power is given at a frequency of 145 MHz. Measurements at other frequencies are extrapolated assuming a spectral index of α = −0.8. |
| In the text | |
|
Fig. 4. The six known GRGs larger than 5 Mpc. Images from LoTSS DR2 are arranged in increasing order of linear size from left to right, with their host galaxy marked by a magenta cross. To save space, all radio galaxies have been rotated so that their major radio axis is vertical. The GRGs are (with their LAS in arcmin, LLS in Mpc, and real PA on the sky, from N through E, listed in parentheses): J1108+2916 (11.6′, > 5.2, 31°), J0901+4420 (11.7′, > 5.4, 170°), J1753−0332 (13.6′, 5.46, 152°), J0103+2305 (24.1′, > 5.9, 101°), J1529+6015 (13.2′, 6.16, 26°), and J0838+5327 (17.2′, 6.6, 22°). The lower limits for the LLS values are due to assuming the lowest reasonable host redshift. |
| In the text | |
|
Fig. 5. Ratio of stronger-to-fainter lobe length for 139 of our 142 GRGs. An ALR > 1 implies that the longer lobe is brighter, while ALR < 1 implies that the shorter lobe is brighter. The vertical red line at ALR = 1 is shown to guide the eye. The black line denotes the median at 0.89. |
| In the text | |
|
Fig. 6. Bending angle (B.A.) measured in degrees, for 139 of our 142 GRGs, plotted against the largest linear size, measured in Mpc. The location of GRG J0814+5224 (Alcyoneus) in this plot is labelled (Oei et al. 2022). The vertical line separates the sample into GRGs with LLS < 4 Mpc and > 4 Mpc. Their median LLS is 3.4 Mpc. |
| In the text | |
|
Fig. 7. The number of known GRGs larger than a given LLS as function of LLS. Blue dots represent the 142 GRGs > 3 Mpc from this publication, and grey dots represent those from Mostert et al. (2024). Lines of fixed slope in this log-log plot are shown for reference. |
| In the text | |
Current usage metrics show cumulative count of Article Views (full-text article views including HTML views, PDF and ePub downloads, according to the available data) and Abstracts Views on Vision4Press platform.
Data correspond to usage on the plateform after 2015. The current usage metrics is available 48-96 hours after online publication and is updated daily on week days.
Initial download of the metrics may take a while.