Fig. 7
Download original image
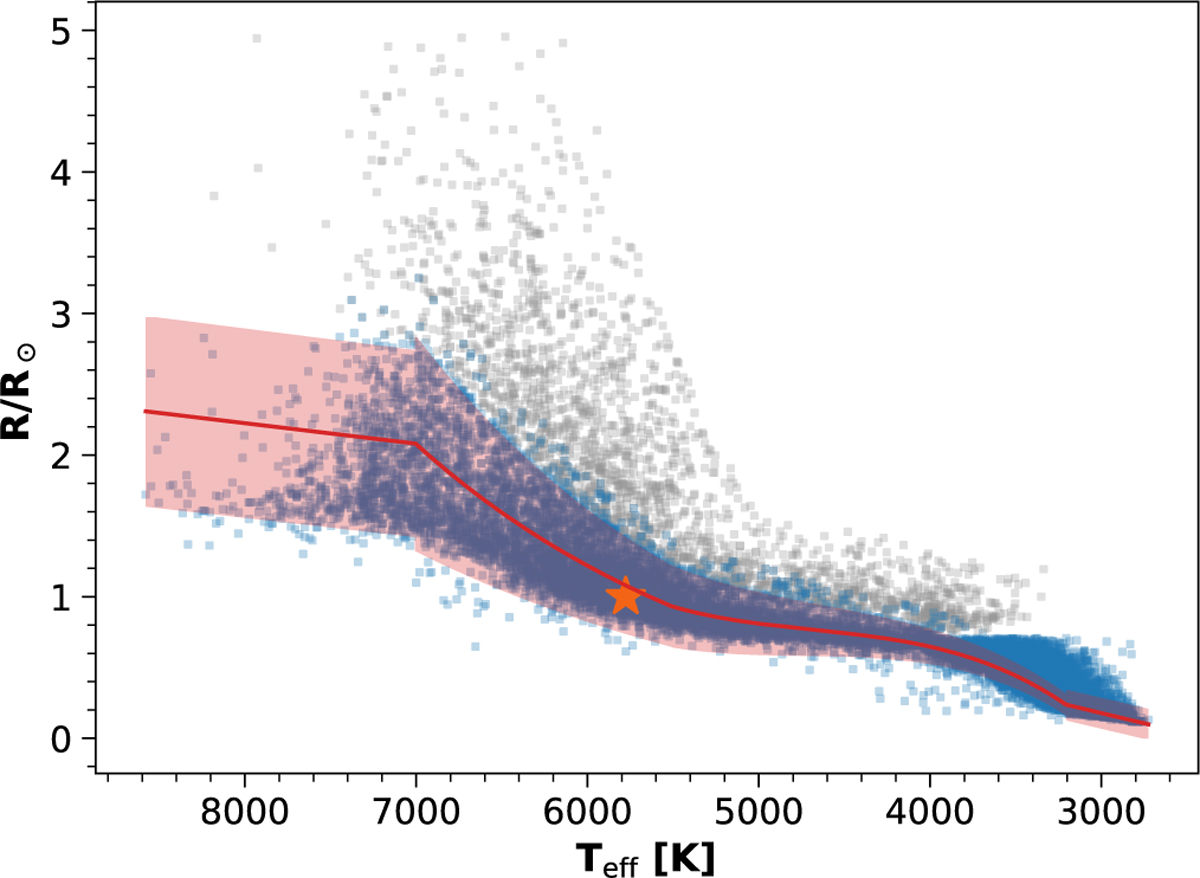
Relation between stellar radius and effective temperature for the 16 000 most active main-sequence stars from Pietras et al. (2022) (blue dots). The red line presents the fit described by Eqs. (10)–(13), the red interval represents the fit error and the orange star corresponds to the parameters of the Sun. The gray points represent possible falsely detected main-sequence stars in the MAST catalog (2000 stars).
Current usage metrics show cumulative count of Article Views (full-text article views including HTML views, PDF and ePub downloads, according to the available data) and Abstracts Views on Vision4Press platform.
Data correspond to usage on the plateform after 2015. The current usage metrics is available 48-96 hours after online publication and is updated daily on week days.
Initial download of the metrics may take a while.