Fig. 6
Download original image
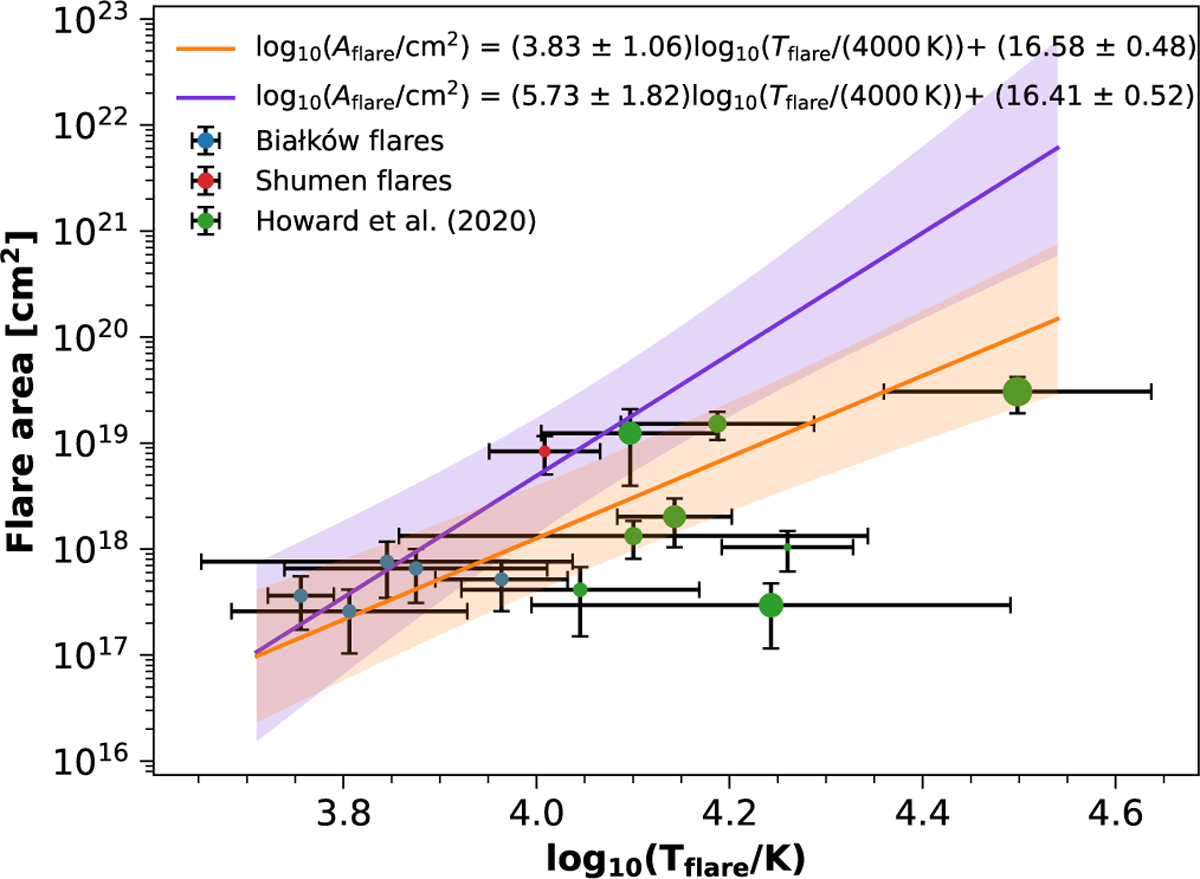
Relationship between flare area and flare peak temperature Tflare. Flares observed at the Białków Observatory are shown in blue, while data from Howard et al. (2020) are represented in green. The flare from the Shumen Observatory is marked in red (Flare 7). The size of the point indicates the radius of the star on which the flare occurred. The purple and the orange curves, along with their shaded regions, illustrate the power-law fit to our observational data and our observational data combined with the data from Howard et al. (2020) respectively.
Current usage metrics show cumulative count of Article Views (full-text article views including HTML views, PDF and ePub downloads, according to the available data) and Abstracts Views on Vision4Press platform.
Data correspond to usage on the plateform after 2015. The current usage metrics is available 48-96 hours after online publication and is updated daily on week days.
Initial download of the metrics may take a while.