Fig. 2.
Download original image
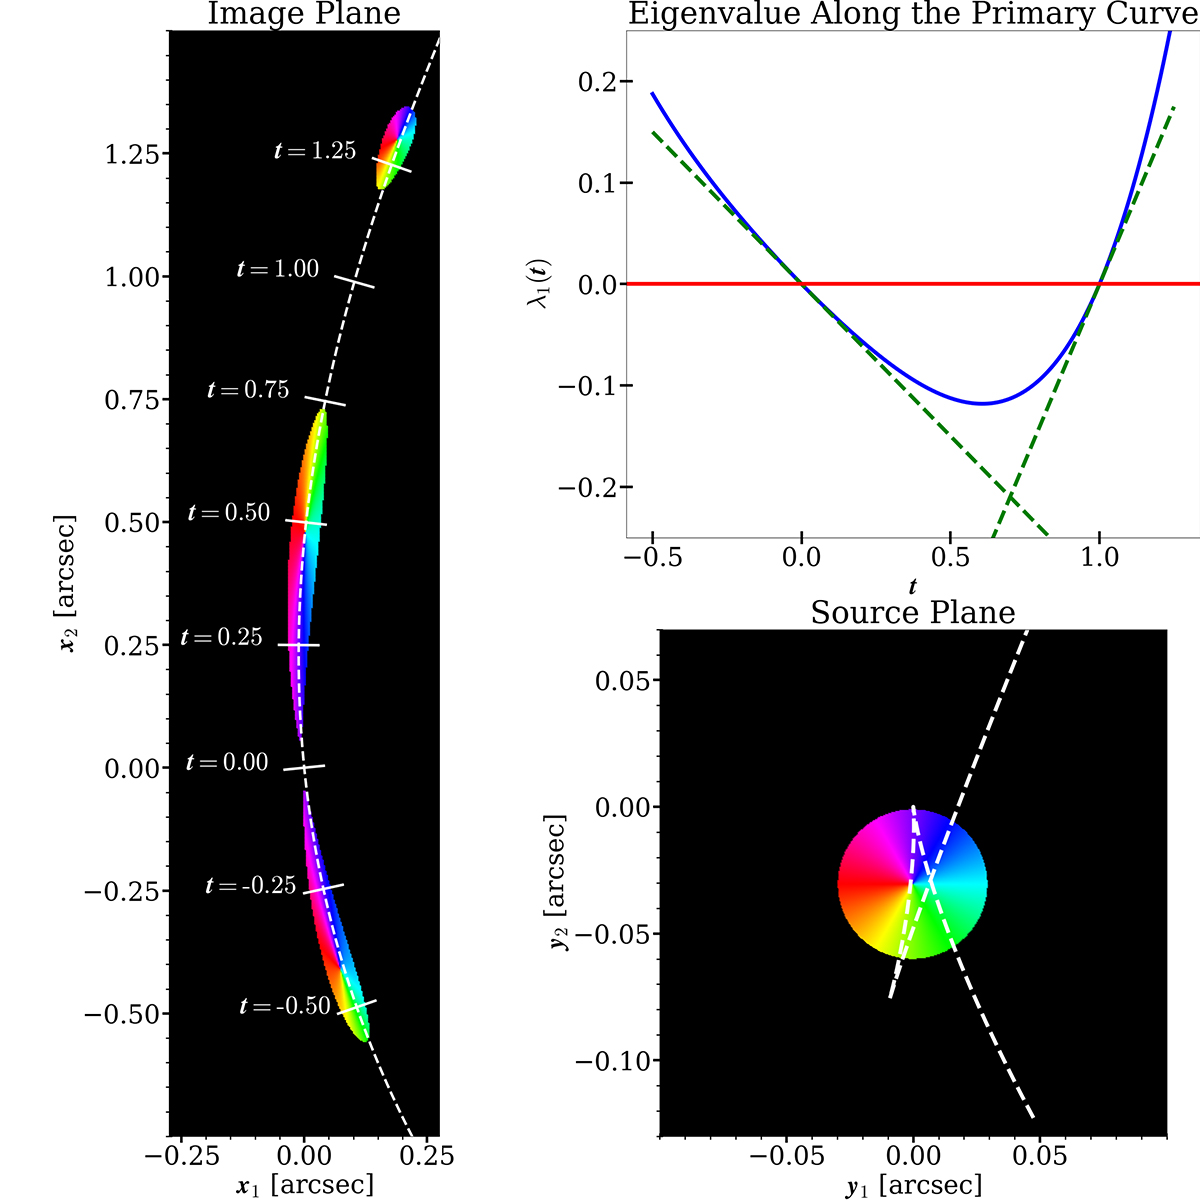
Qualitative illustration of lensing along a primary curve. Left: The lensed images of a disk shaped color wheel source. The dashed curve shows the primary curve ξ(t) parameterized by t. The values of t along the primary curve are shown as solid ticks. Top-right: Values of the primary eigenvalue λ1(t) along the primary curve. The places where λ1(t) hits 0 corresponds to the critical curve crossings where the magnification is infinite. Bottom-right: Unlensed image of the color wheel source. The dashed curve shows the set of points that we get when we map the primary curve onto the source plane.
Current usage metrics show cumulative count of Article Views (full-text article views including HTML views, PDF and ePub downloads, according to the available data) and Abstracts Views on Vision4Press platform.
Data correspond to usage on the plateform after 2015. The current usage metrics is available 48-96 hours after online publication and is updated daily on week days.
Initial download of the metrics may take a while.