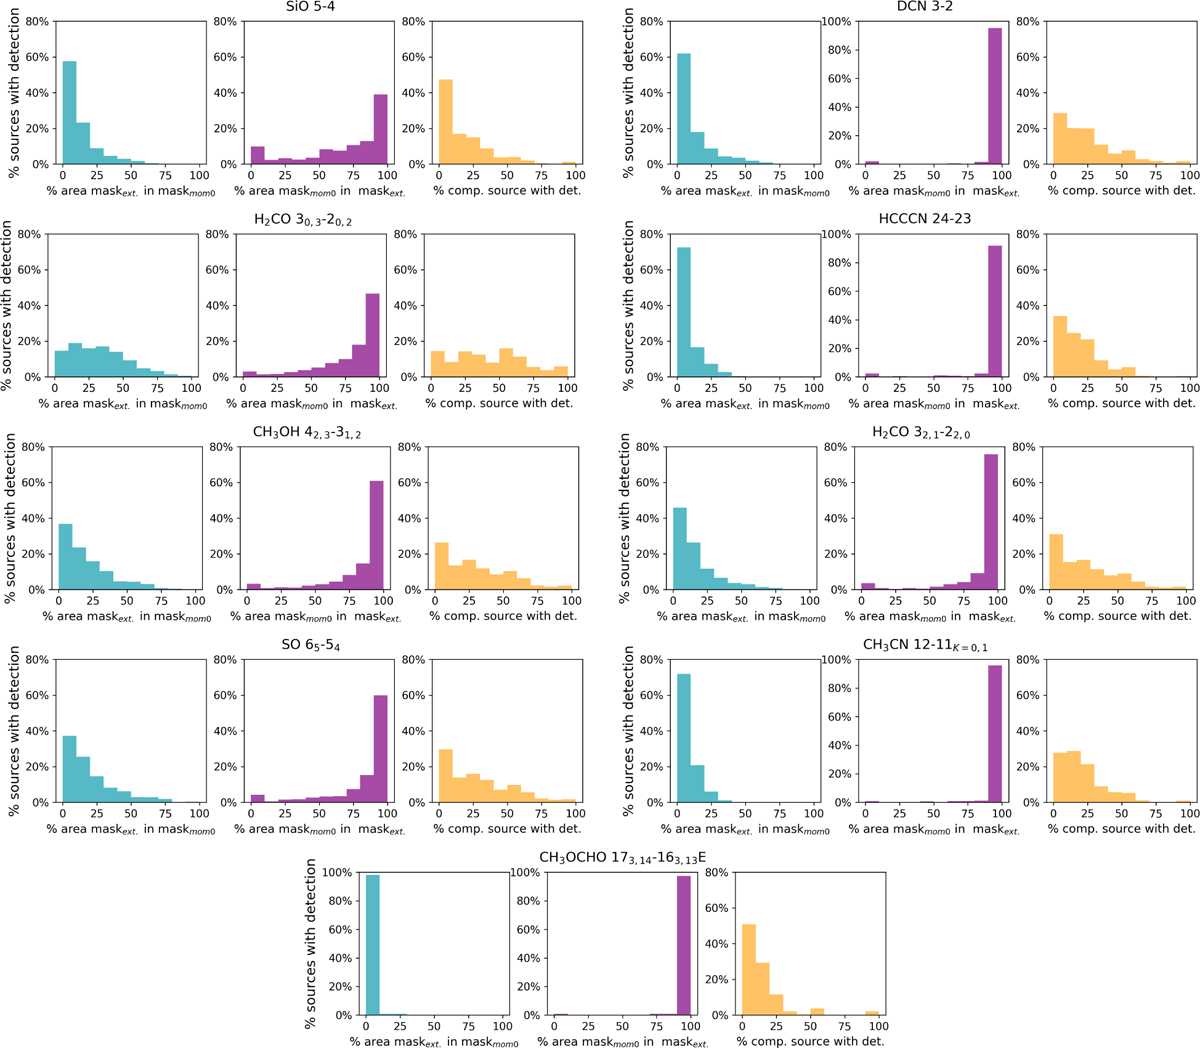
Fig. 8
Download original image
For each molecular transition, three histograms are presented. The blue histogram shows the percentage of maskext. covered by the moment-0 mask of the selected transition. The purple histogram shows the percentage of the moment-0 mask of the selected transition covered by the maskext.. The yellow histogram shows the percentage of compact sources in which the transition is detected, that is compact sources with at least 60% of the area covered by the moment-0 mask of the selected transition.
Current usage metrics show cumulative count of Article Views (full-text article views including HTML views, PDF and ePub downloads, according to the available data) and Abstracts Views on Vision4Press platform.
Data correspond to usage on the plateform after 2015. The current usage metrics is available 48-96 hours after online publication and is updated daily on week days.
Initial download of the metrics may take a while.