Open Access
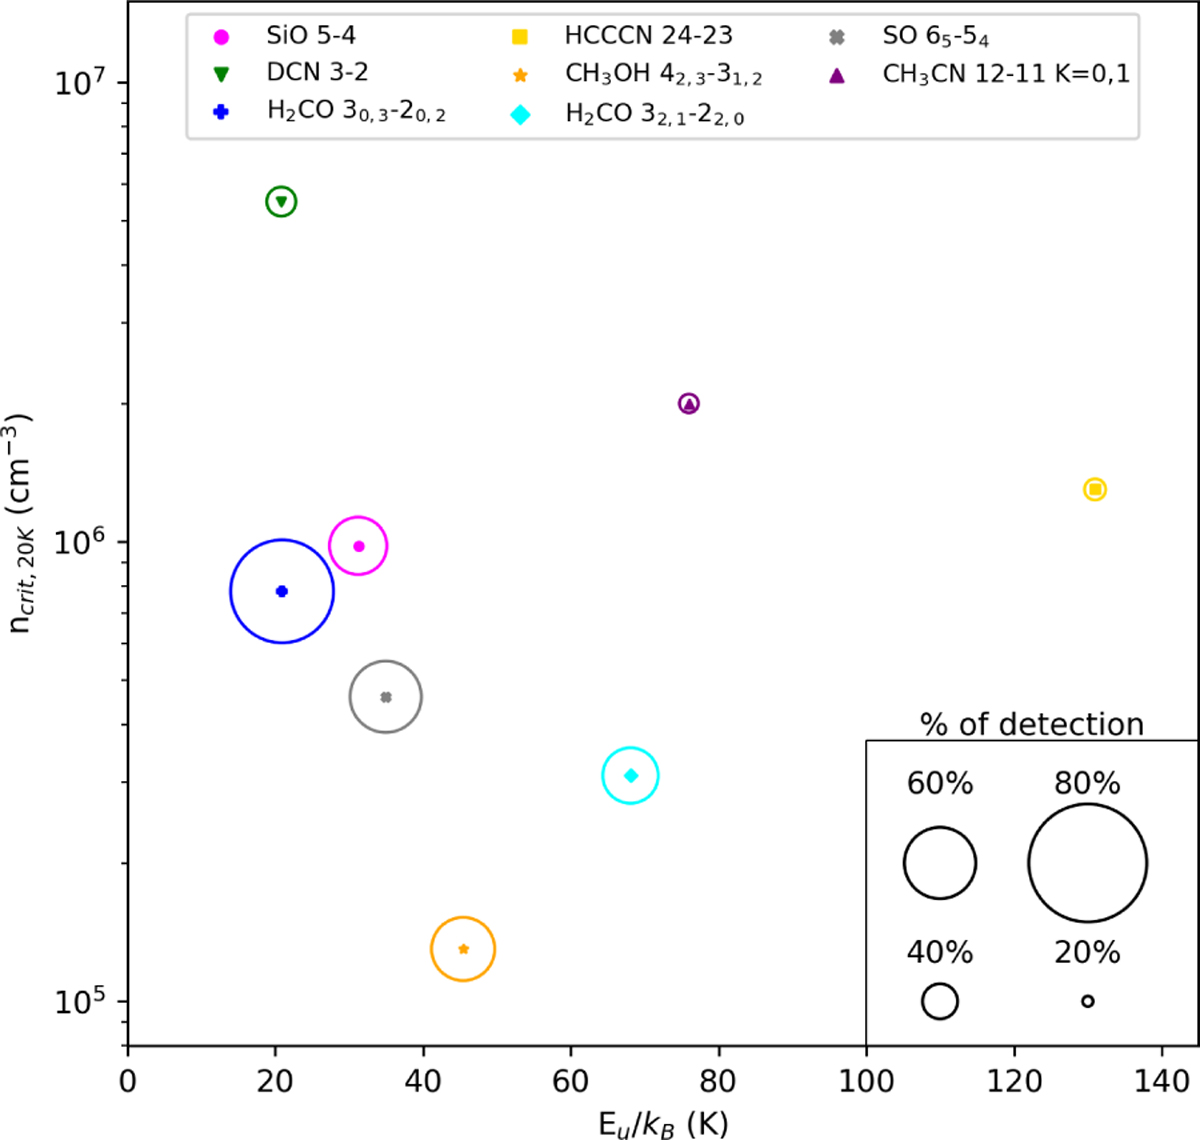
Fig. 6
Download original image
Percentage of detection on the whole sample of the molecular transitions, shown as the diameter of the circles, in a scatter plot of the upper state energy transition and of the critical density at 20 K of the transition.
Current usage metrics show cumulative count of Article Views (full-text article views including HTML views, PDF and ePub downloads, according to the available data) and Abstracts Views on Vision4Press platform.
Data correspond to usage on the plateform after 2015. The current usage metrics is available 48-96 hours after online publication and is updated daily on week days.
Initial download of the metrics may take a while.