Fig. 3
Download original image
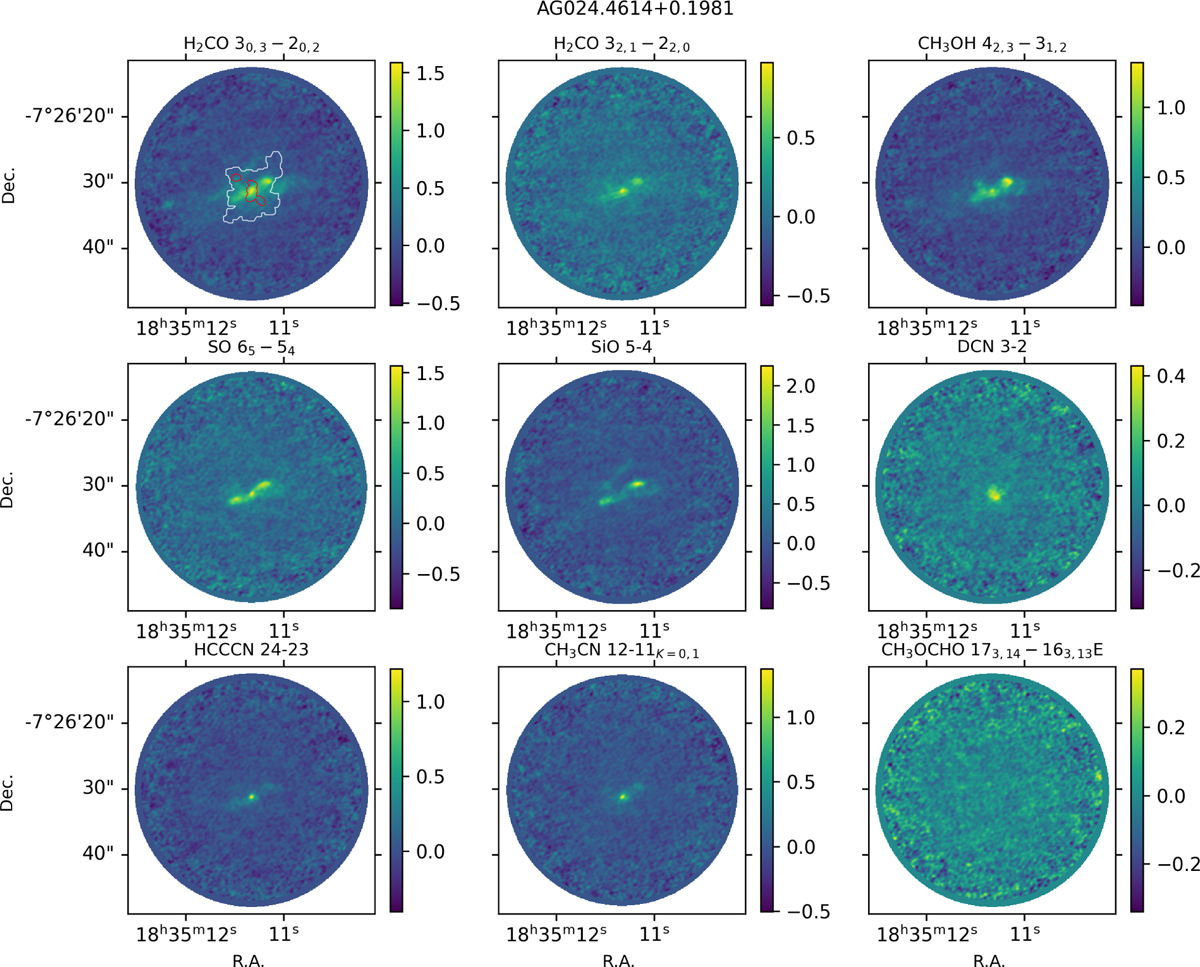
Moment-0 maps of all the transitions for the source AG024.4614+0.1981. The color scales are in units Jy beam−1 km s−1. In the upper left panel, we show the continuum emission masks for reference. The red contour shows the mask of all the compact sources inside the source. The white contour shows the mask of the continuum emission with an S/N higher than 3.
Current usage metrics show cumulative count of Article Views (full-text article views including HTML views, PDF and ePub downloads, according to the available data) and Abstracts Views on Vision4Press platform.
Data correspond to usage on the plateform after 2015. The current usage metrics is available 48-96 hours after online publication and is updated daily on week days.
Initial download of the metrics may take a while.