Open Access
Fig. E.1
Download original image
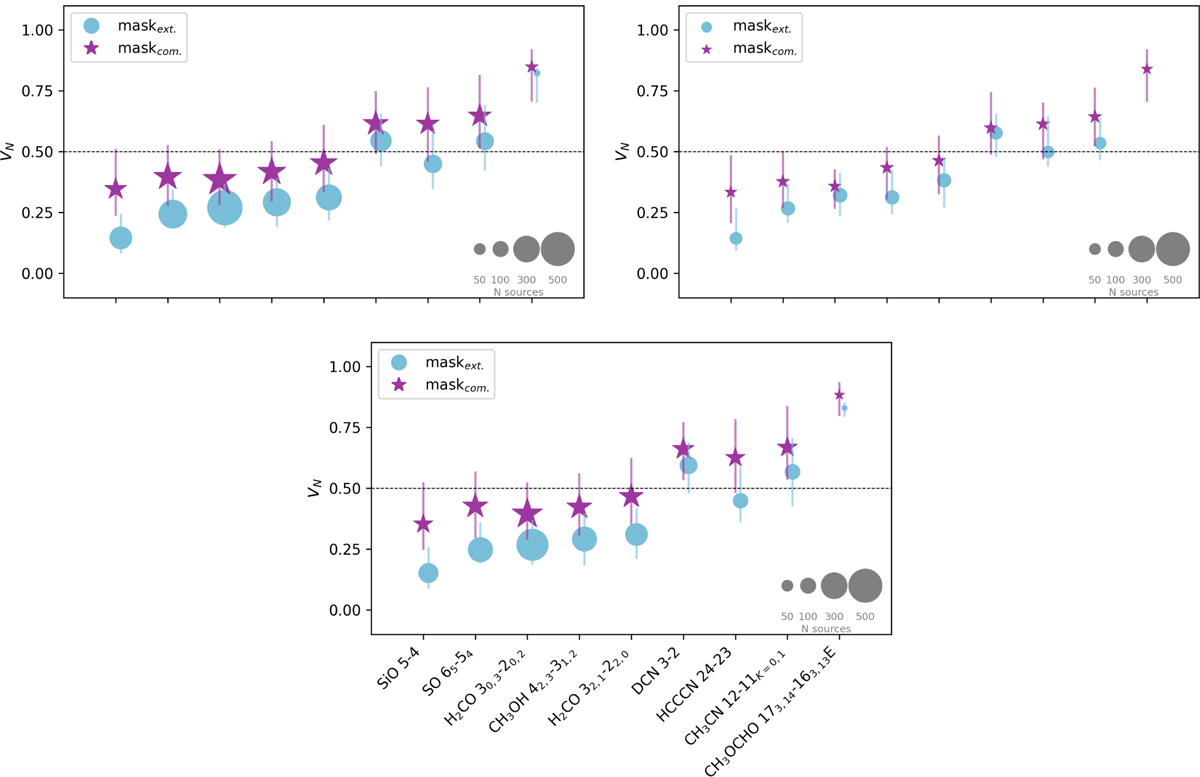
Top left panel: same of Fig. 9, that is, results of the astroHOG analysis on all the sample; top right panel: same plot only for the sources for which the automated routine for the creation of moment-0 maps failed; bottom panel: same plot excluding from all the sources those with a CORNISH counterpart.
Current usage metrics show cumulative count of Article Views (full-text article views including HTML views, PDF and ePub downloads, according to the available data) and Abstracts Views on Vision4Press platform.
Data correspond to usage on the plateform after 2015. The current usage metrics is available 48-96 hours after online publication and is updated daily on week days.
Initial download of the metrics may take a while.