Fig. C.2
Download original image
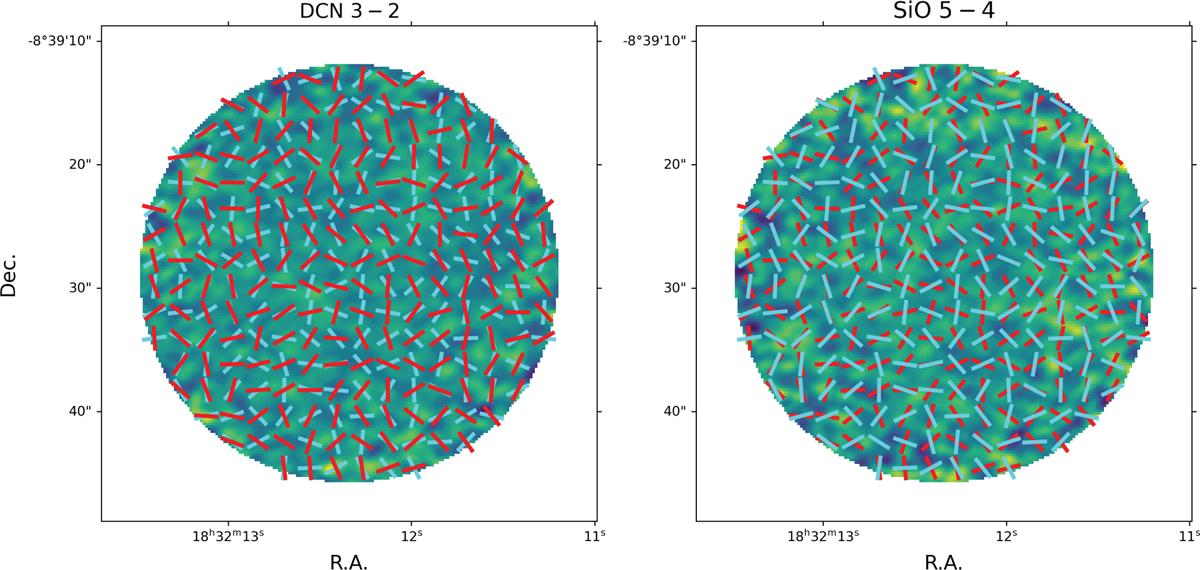
Gradients comparison on a pair of noise-only maps from Table C.1 for source AG023.0417+0.2925. The color scale units are Jy/beam km s−1 in both panels. The cyan lines indicate the direction of the gradients of the noise map in the left panel, while the red lines indicate the direction of the gradient of the noise map in the right panel. For this pair of noise maps VN is 0.013.
Current usage metrics show cumulative count of Article Views (full-text article views including HTML views, PDF and ePub downloads, according to the available data) and Abstracts Views on Vision4Press platform.
Data correspond to usage on the plateform after 2015. The current usage metrics is available 48-96 hours after online publication and is updated daily on week days.
Initial download of the metrics may take a while.