Fig. 14
Download original image
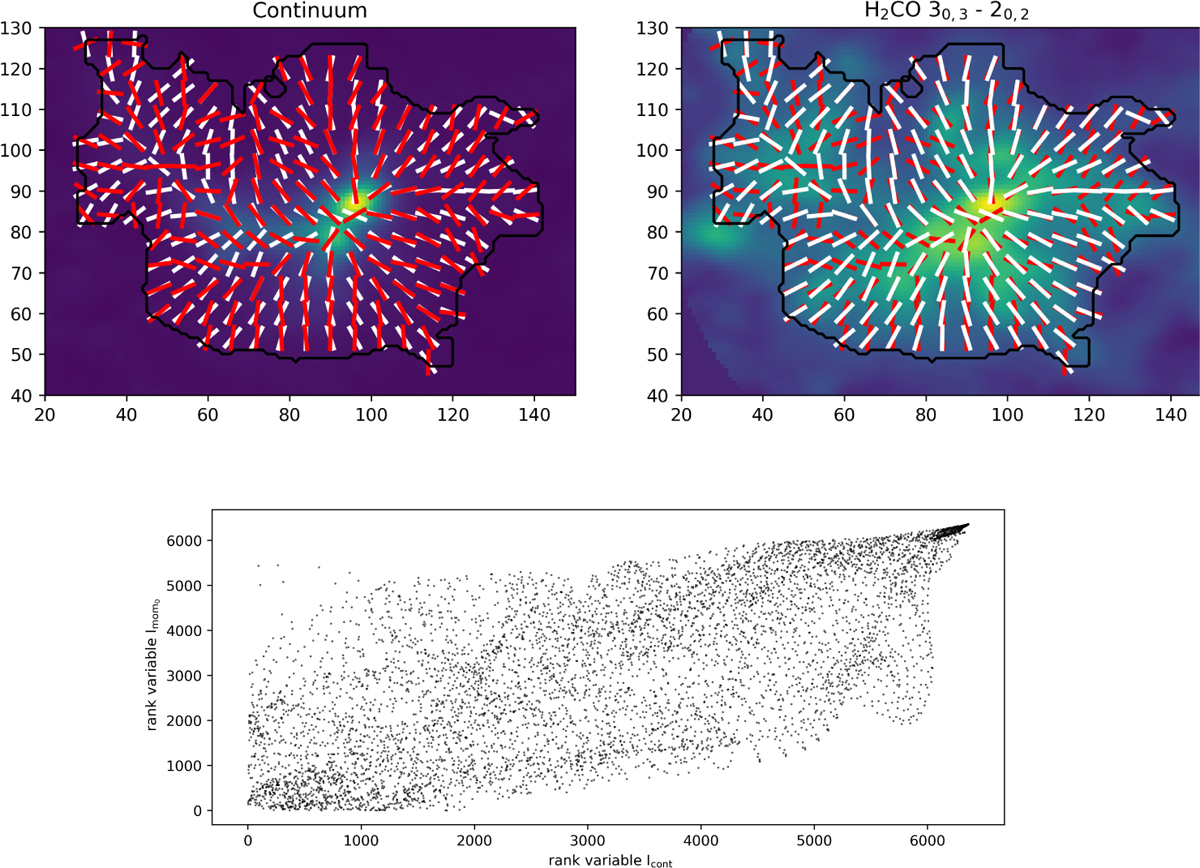
Example of a source for which the HOG method indicates a low morphological correlation and the Spearman correlation indicates a high correlation. The source is AG019.8843-0.5337 and in the comparison of the continuum and of the moment-0 of H2CO 30,3−20,2 in the maskext. VN=0.20, while ρs = 0.67. The two panels in the upper row show the continuum and the moment-0 map of H2CO 30,3−20,2 with superimposed the directions of the gradients in the two maps (red: moment-0, white: continuum, respectively). The panel in the lower row shows the scatter plot of the pixel-to-pixel rank variables in the two maps inside the same mask (in black in the images of the two maps) where both the Spearman correlation and the Projected Rayleigh Statistic, VN, have been computed.
Current usage metrics show cumulative count of Article Views (full-text article views including HTML views, PDF and ePub downloads, according to the available data) and Abstracts Views on Vision4Press platform.
Data correspond to usage on the plateform after 2015. The current usage metrics is available 48-96 hours after online publication and is updated daily on week days.
Initial download of the metrics may take a while.