Fig. 1
Download original image
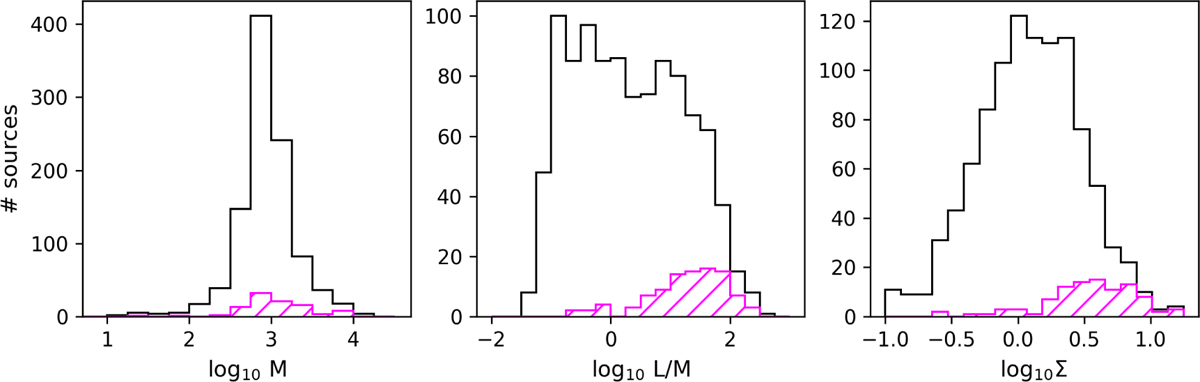
Physical properties of the clumps in the ALMAGAL sample (shown in black). The subsample for which we created moment-0 maps using a fixed velocity range of ±5 km/s around the clump systemic velocity (see Section 4.1) is shown in magenta with shading. From left to right: mass of the clumps M in units of M⊙, the L/M ratio of the clumps in units of L⊙/M⊙, and the surface density of the clumps Σ in units of g/cm2.
Current usage metrics show cumulative count of Article Views (full-text article views including HTML views, PDF and ePub downloads, according to the available data) and Abstracts Views on Vision4Press platform.
Data correspond to usage on the plateform after 2015. The current usage metrics is available 48-96 hours after online publication and is updated daily on week days.
Initial download of the metrics may take a while.