Fig. 1.
Download original image
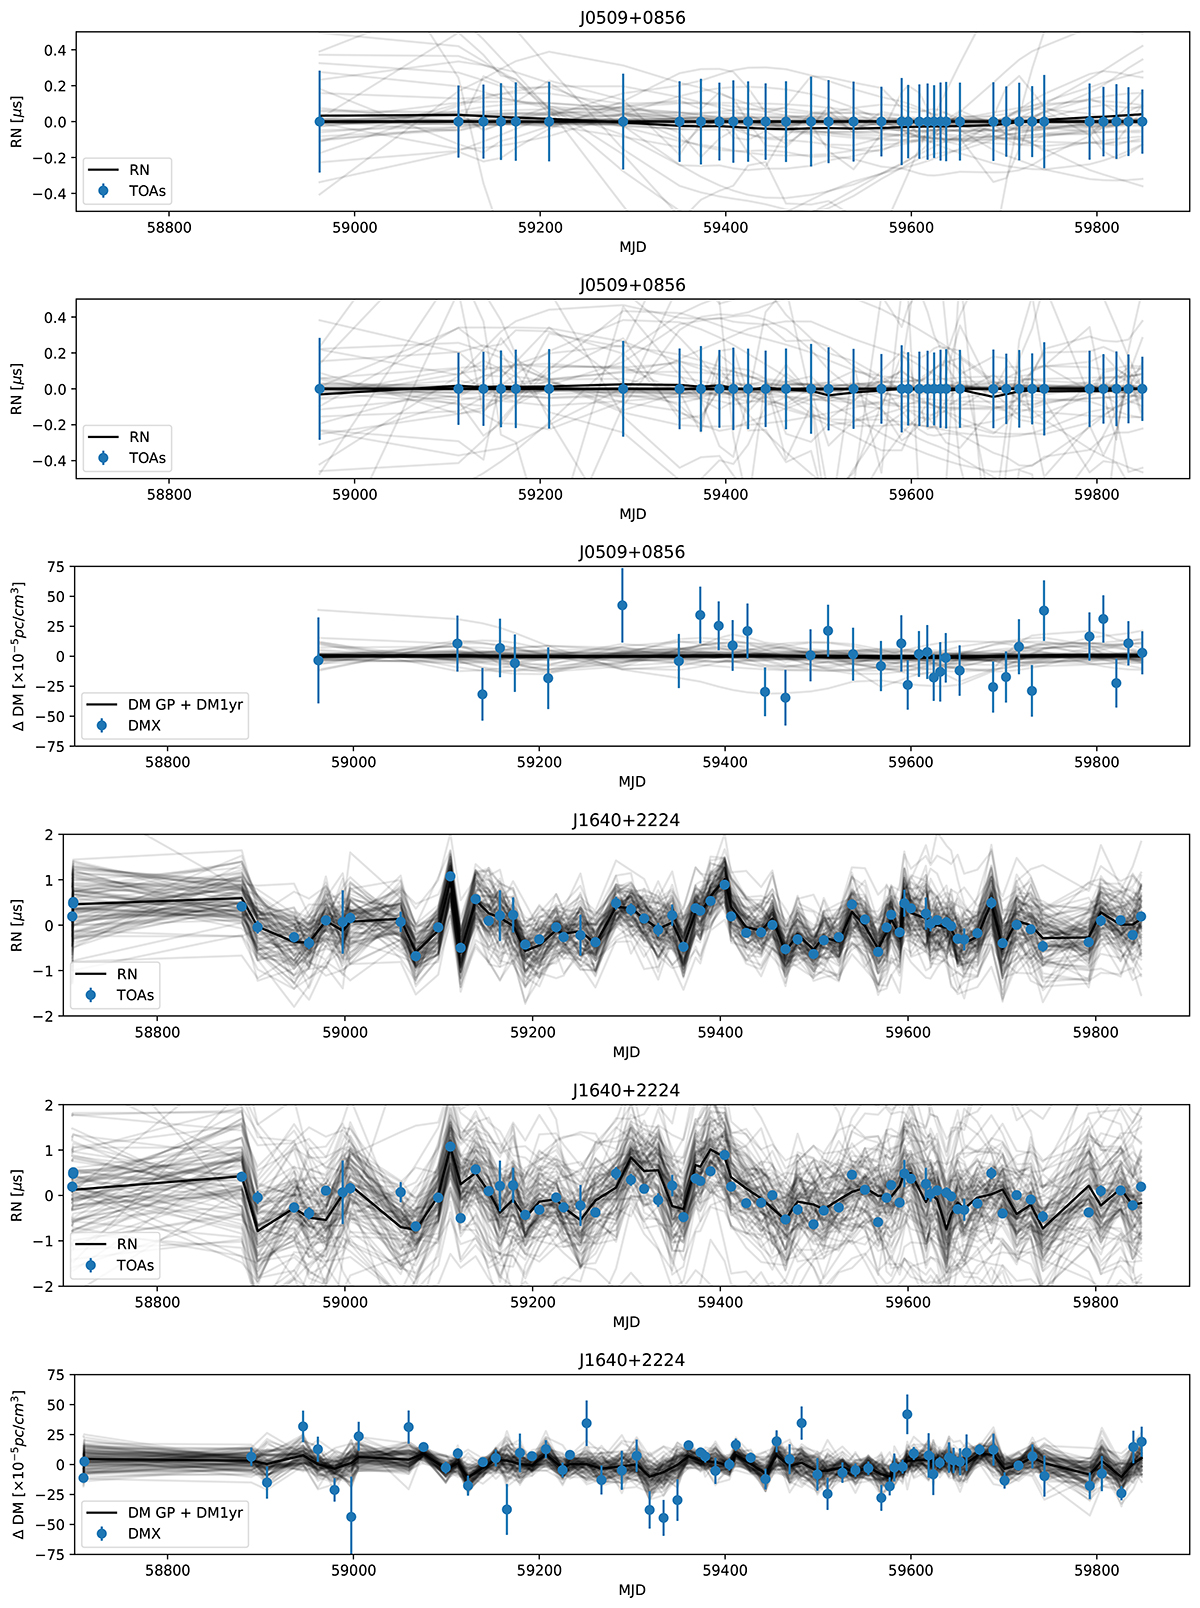
Time series reconstructions for J0509+0856 in the top three and J1640+2224 in the bottom three panels. From top to bottom, each set of three panels shows the red noise for the DM GP and DMX datasets, as well as the DM GP reconstructions compared the DMX values (where linear and quadratic trends have been removed). The blue points indicate the median residual values and 1σ uncertainties.
Current usage metrics show cumulative count of Article Views (full-text article views including HTML views, PDF and ePub downloads, according to the available data) and Abstracts Views on Vision4Press platform.
Data correspond to usage on the plateform after 2015. The current usage metrics is available 48-96 hours after online publication and is updated daily on week days.
Initial download of the metrics may take a while.