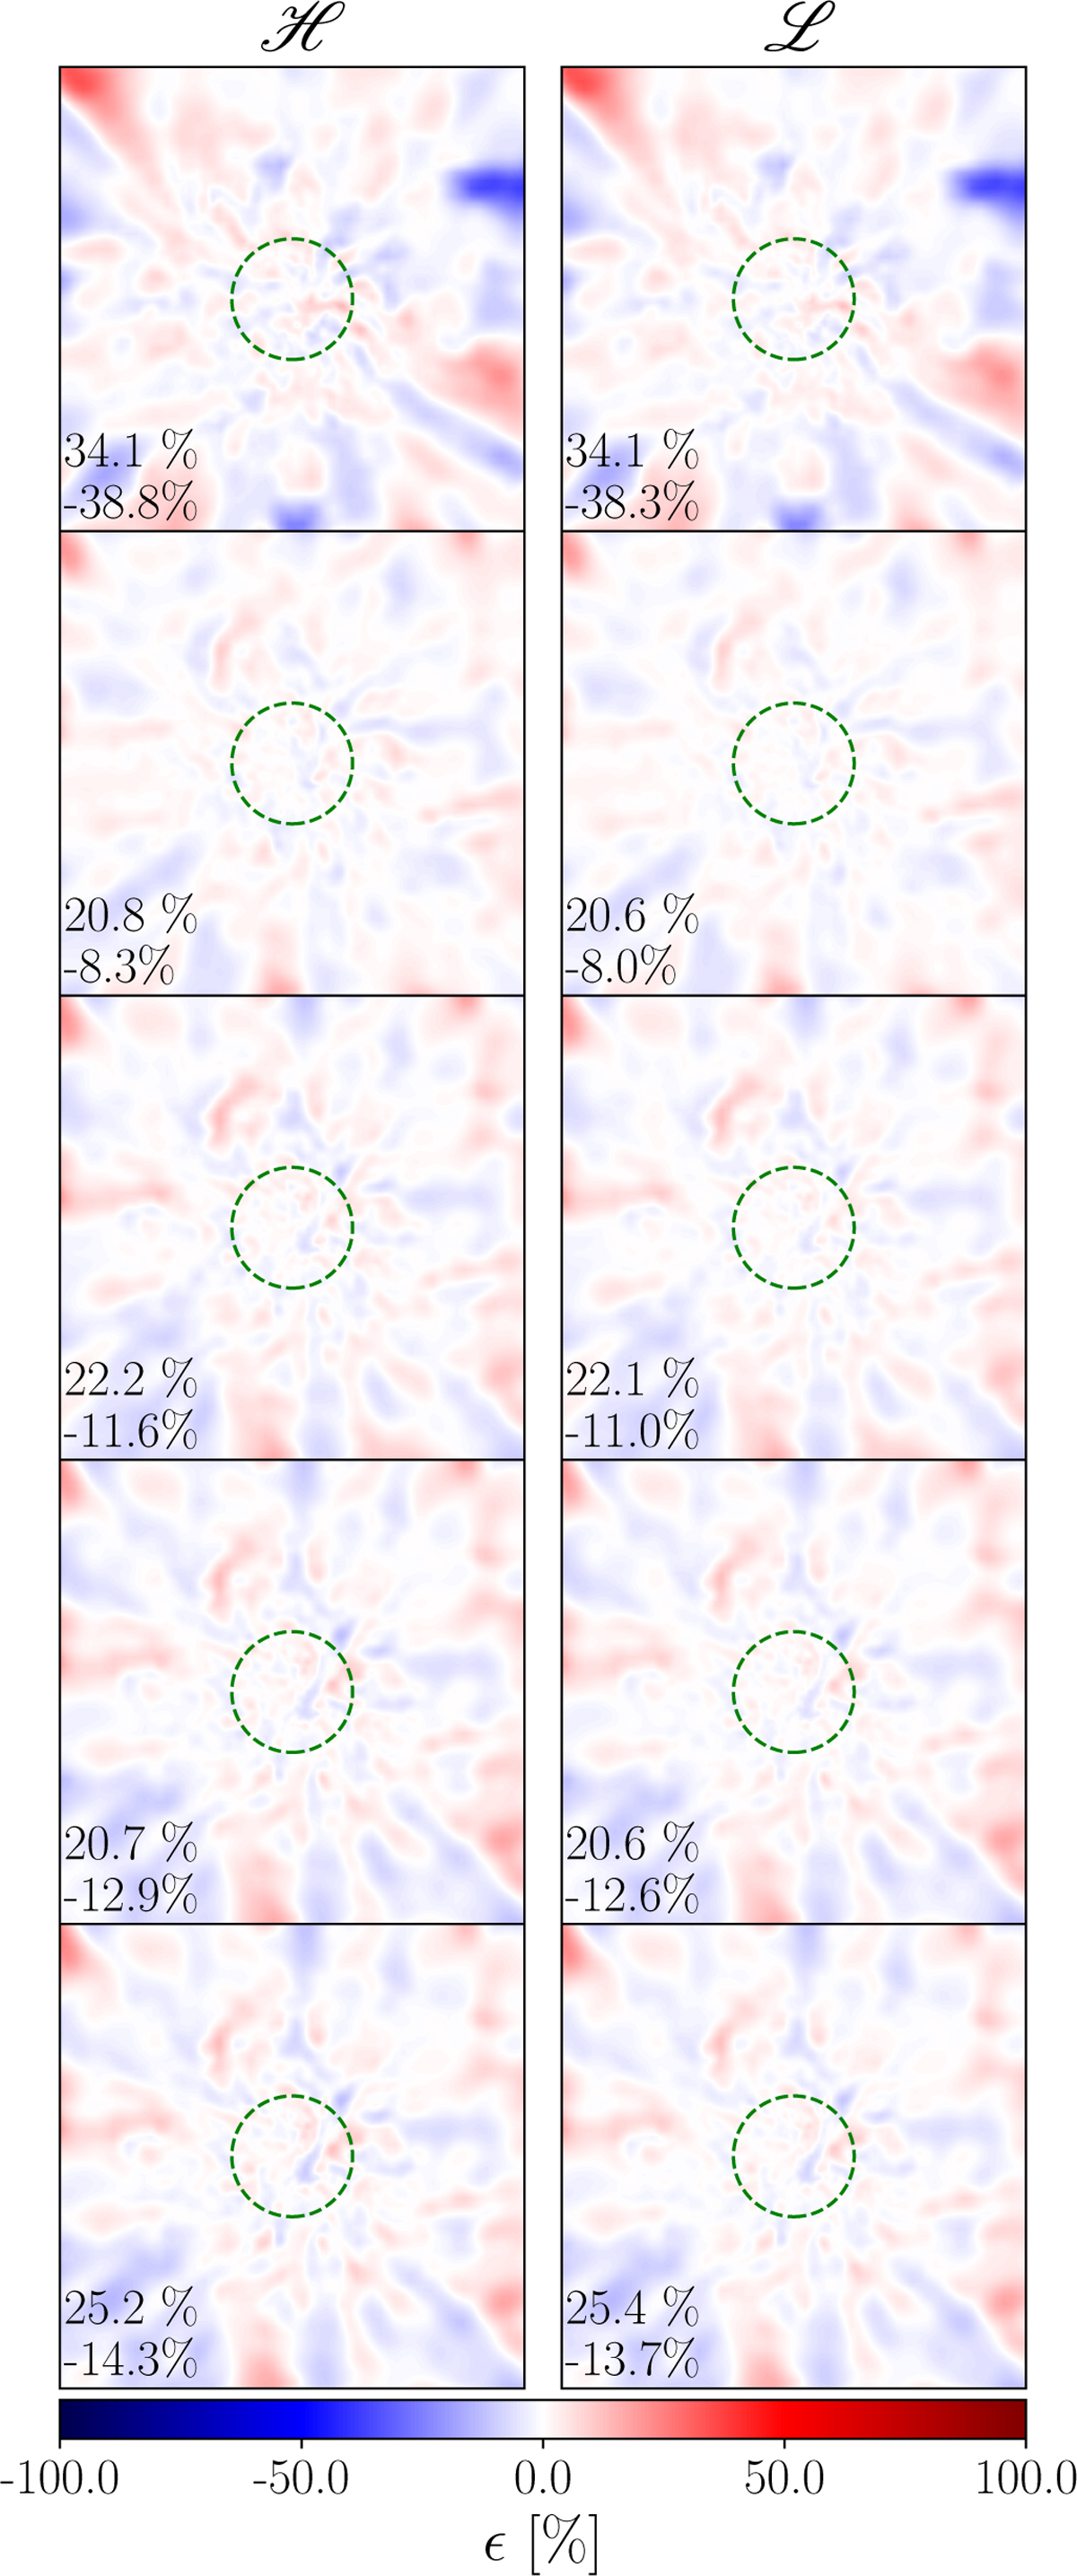
Fig. B.1
Download original image
Relative error (ϵ) for ℋ (left) and ℒ (right) within a 0.5 × 0.5 × 0.2 pc3 at 153.3 kyr. We chose this box size to take into account the 0.5 pc of injection and a depth length similar to the filament scale (0.2 pc) to avoid the inclusion of background particles. The errors are calculated between X2 case and the rest. The panels are, from top to bottom: X1, X4, X8, X16 and X32. The bluer and redder indicate underestimation and overestimation of X2 relative to the others. The maximum and minimum errors for each comparison are written in the bottom-left corner. All green spheres have 0.065 pc radii.
Current usage metrics show cumulative count of Article Views (full-text article views including HTML views, PDF and ePub downloads, according to the available data) and Abstracts Views on Vision4Press platform.
Data correspond to usage on the plateform after 2015. The current usage metrics is available 48-96 hours after online publication and is updated daily on week days.
Initial download of the metrics may take a while.