Fig. 7
Download original image
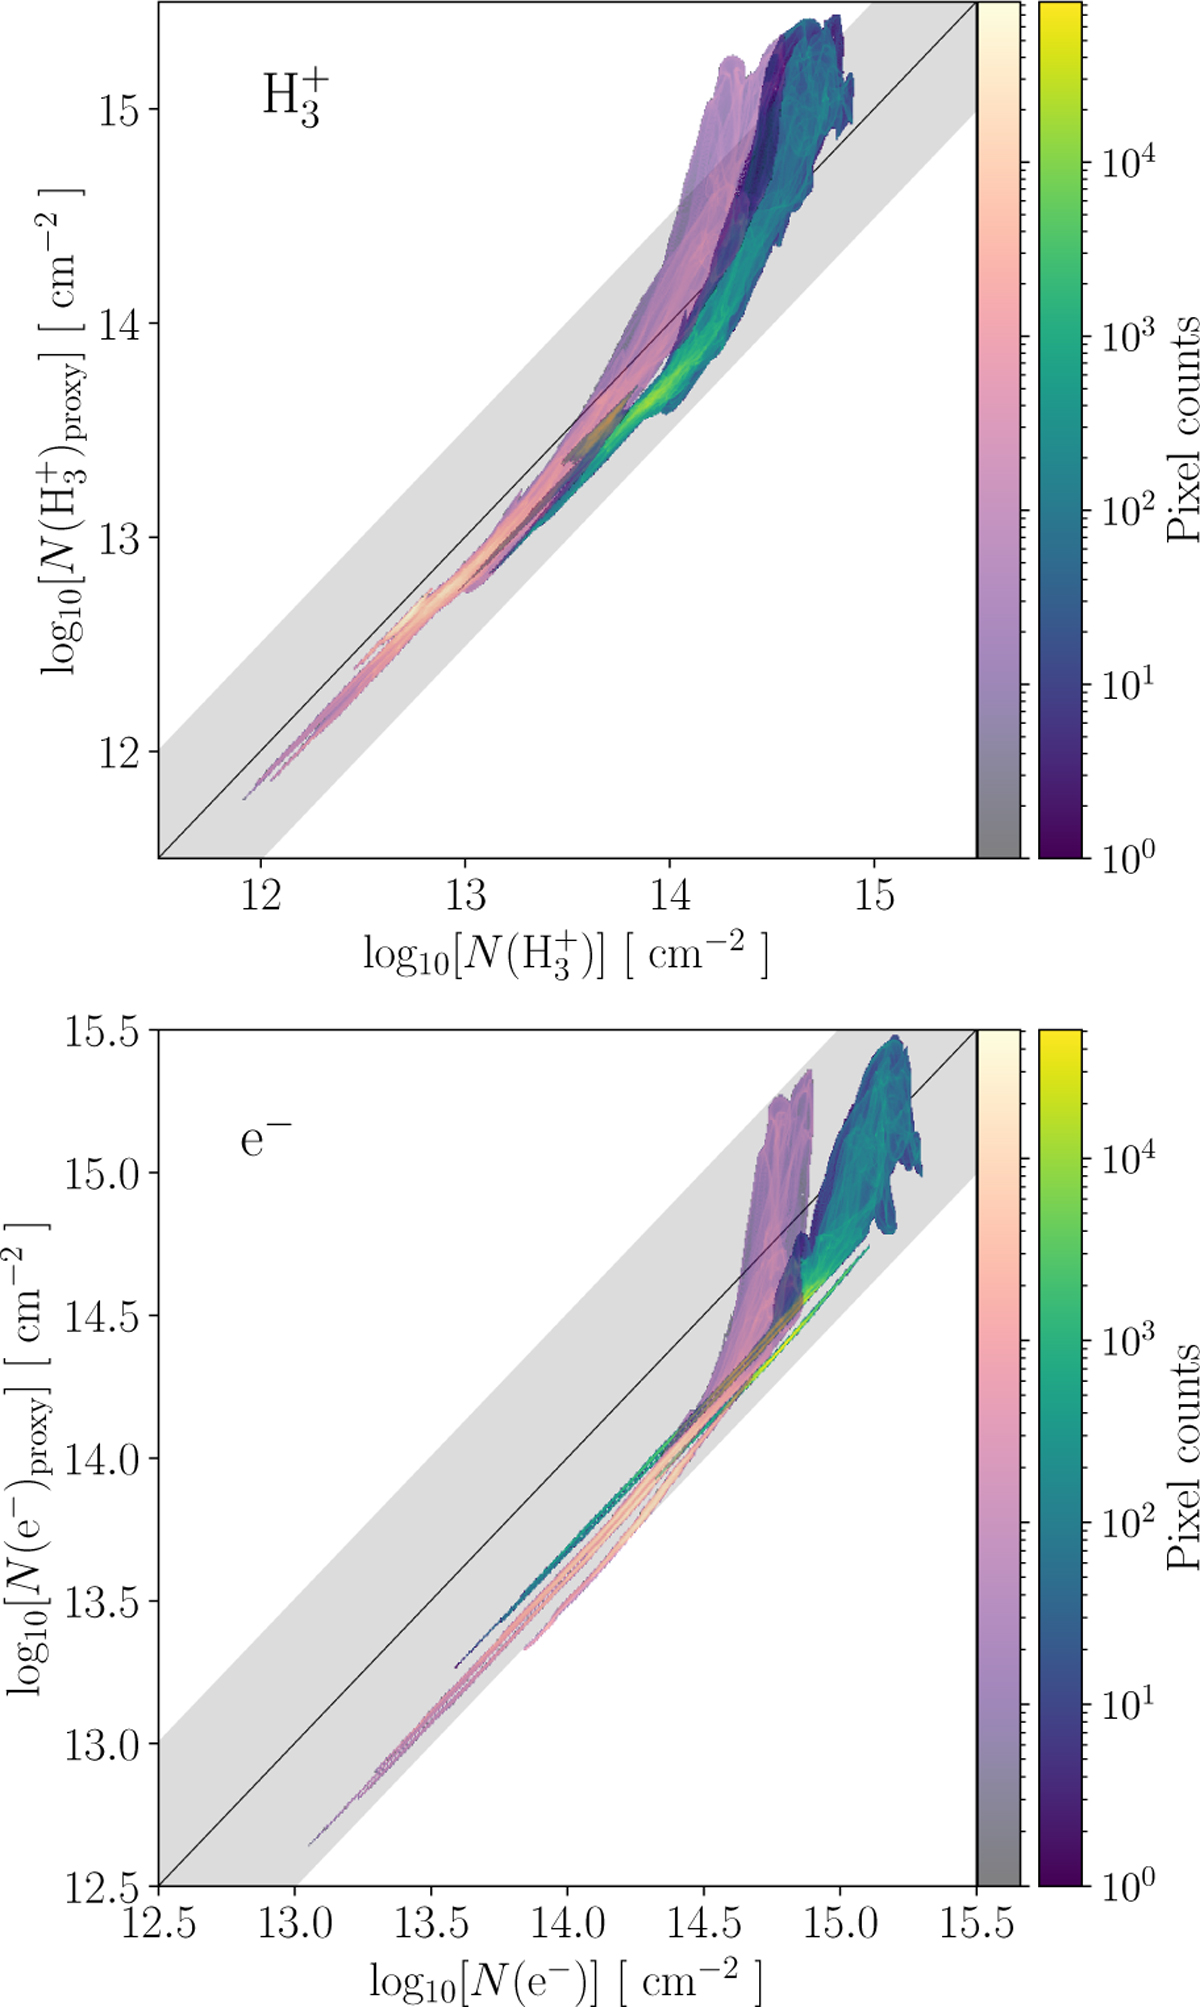
Pixel-by-pixel 2D histogram distributions for the ℋ (viridis) and ℒ (magma) model by combining different times (t = 30.7, 95.0, and 153.3 kyr). The upper panel correlates the ![]() column density obtained from KROME and
column density obtained from KROME and ![]() calculated as Eq. (14). The bottom panel shows the correlation between the e− column density and its proxy calculated by Eq. (16). The solid black line represents a 1:1 straight line and serves as an indicator for the lineal correlation formed by the 2D histogram distributions. The grey shadow indicates a region spanning one order of magnitude (−0.5 and +0.5) around the 1:1 black line.
calculated as Eq. (14). The bottom panel shows the correlation between the e− column density and its proxy calculated by Eq. (16). The solid black line represents a 1:1 straight line and serves as an indicator for the lineal correlation formed by the 2D histogram distributions. The grey shadow indicates a region spanning one order of magnitude (−0.5 and +0.5) around the 1:1 black line.
Current usage metrics show cumulative count of Article Views (full-text article views including HTML views, PDF and ePub downloads, according to the available data) and Abstracts Views on Vision4Press platform.
Data correspond to usage on the plateform after 2015. The current usage metrics is available 48-96 hours after online publication and is updated daily on week days.
Initial download of the metrics may take a while.