Fig. 6
Download original image
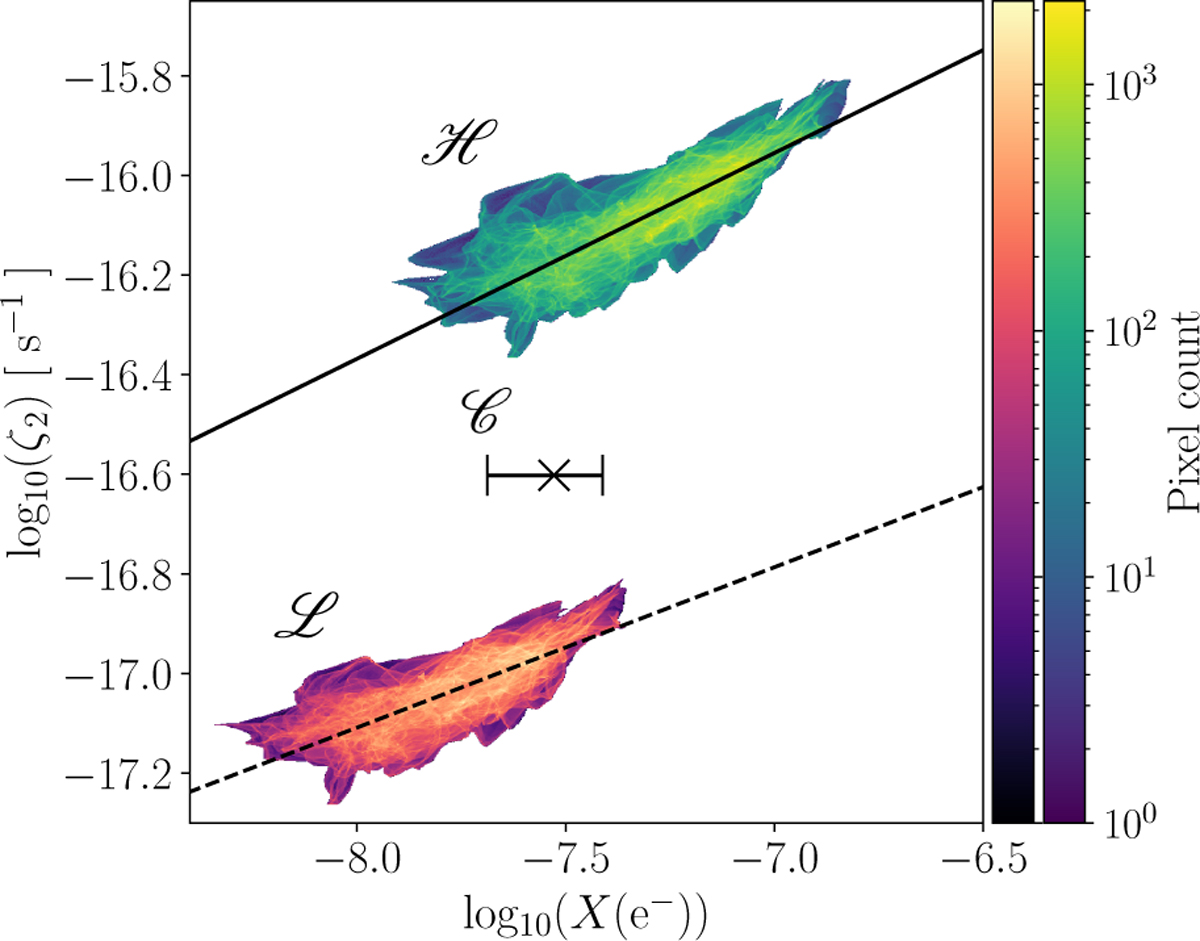
Correlation between X(e−)and ζ2 obtained from the 2D maps (line-of-sight averages) for models ℋ (outermost color scale) and ℒ (innermost color scale), combining different time snapshots (t = 30.7, 95.0, and 153.3 kyr). The solid and dashed lines correspond to power-law fits. The cross located at log10(ζc) = −16.6 represents the median of the electron abundance (X(e−)) for the ℒ model, and the error bars are the 1σ of the data.
Current usage metrics show cumulative count of Article Views (full-text article views including HTML views, PDF and ePub downloads, according to the available data) and Abstracts Views on Vision4Press platform.
Data correspond to usage on the plateform after 2015. The current usage metrics is available 48-96 hours after online publication and is updated daily on week days.
Initial download of the metrics may take a while.