Fig. 5
Download original image
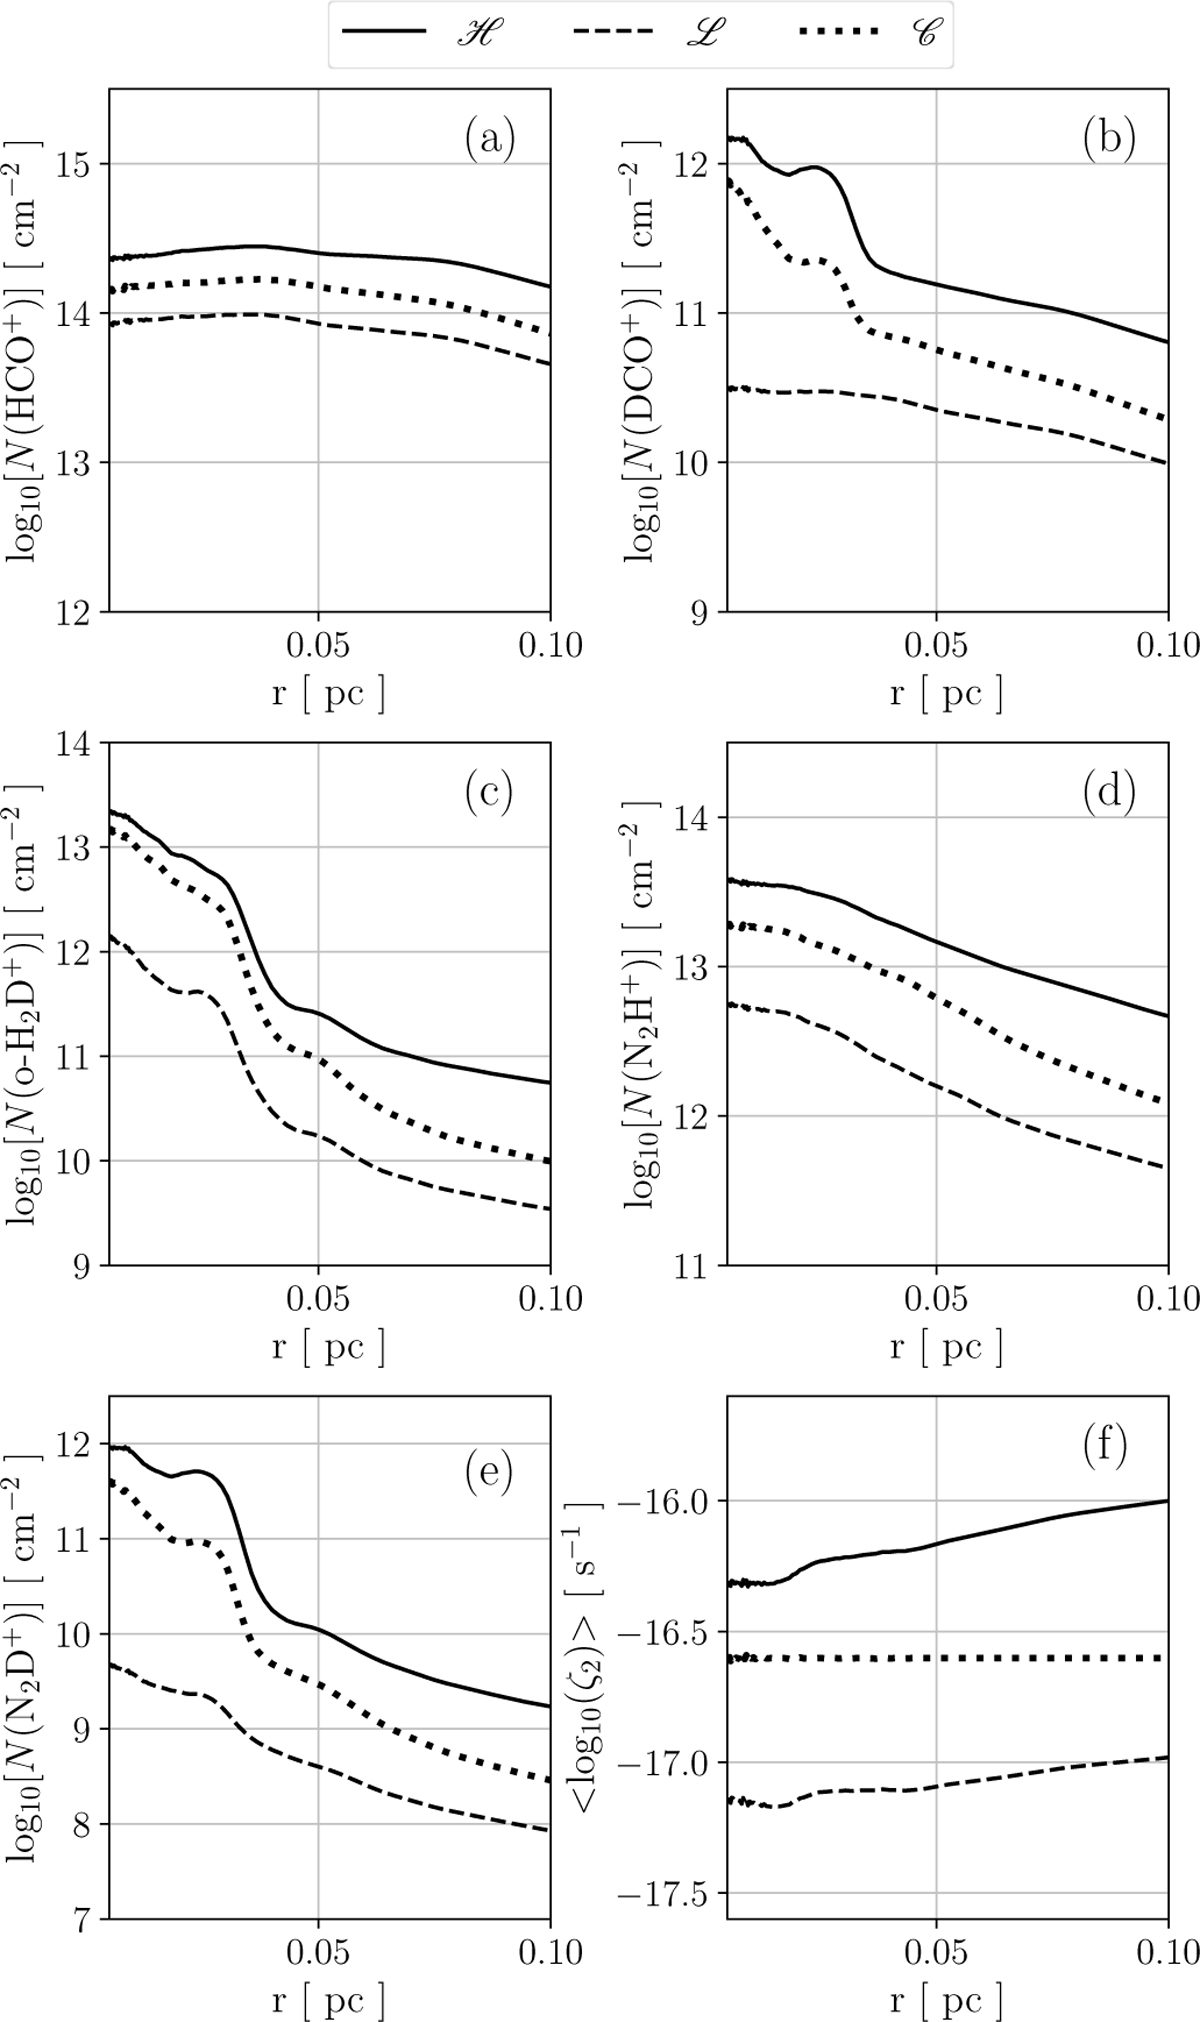
Radial profiles of the column densities of HCO+(a), DCO+ (b), o-H2D+(c), N2H+(d), and N2D+(e) ions and the ζ2 distribution (f) at 153.3 kyr. The ζ2 radial profile is calculated in circular annuli from the average along the line of sight (as shown in Fig. 2). The CR ionisation models ℋ, ℒ, and ℒ are represented by solid, dashed, and dotted black lines, respectively.
Current usage metrics show cumulative count of Article Views (full-text article views including HTML views, PDF and ePub downloads, according to the available data) and Abstracts Views on Vision4Press platform.
Data correspond to usage on the plateform after 2015. The current usage metrics is available 48-96 hours after online publication and is updated daily on week days.
Initial download of the metrics may take a while.