Open Access
Fig. 4
Download original image
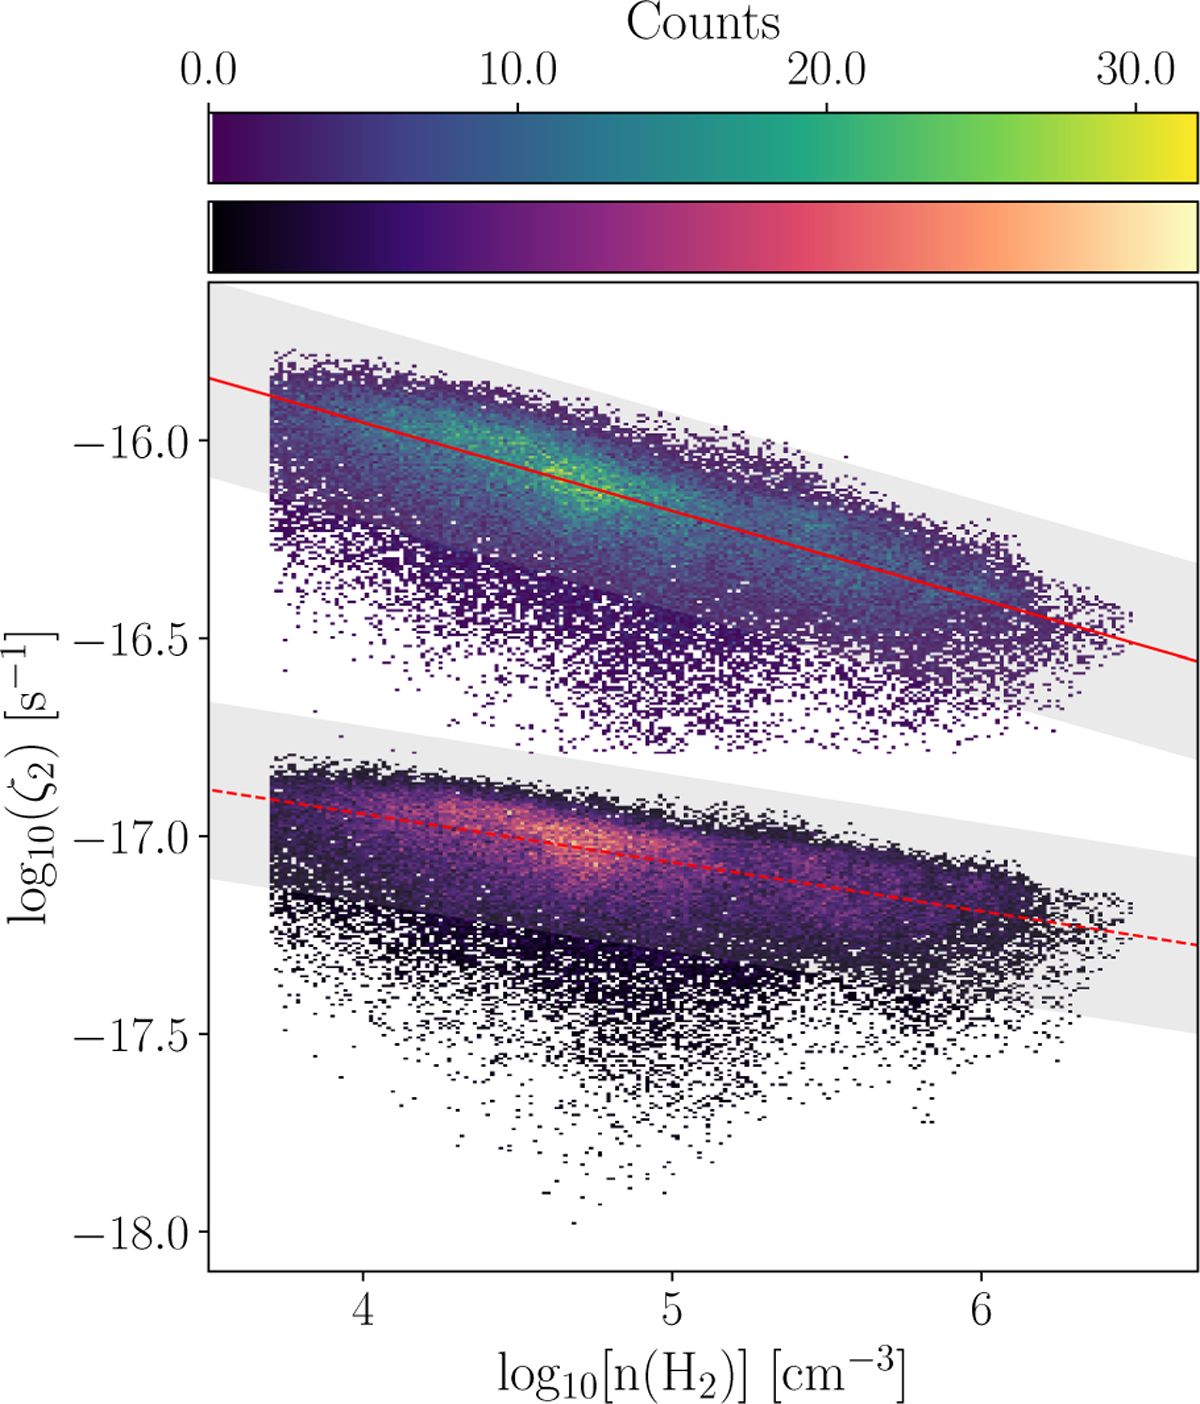
Correlation between ζ2 and n(H2) at 153.3 kyr. The viridis and magma color maps represent the ℋ and ℒ models, respectively. The solid and dashed red lines correspond to our best-fit relations, and the shaded grey areas show the intrinsic scatter discussed in Section 3.2.
Current usage metrics show cumulative count of Article Views (full-text article views including HTML views, PDF and ePub downloads, according to the available data) and Abstracts Views on Vision4Press platform.
Data correspond to usage on the plateform after 2015. The current usage metrics is available 48-96 hours after online publication and is updated daily on week days.
Initial download of the metrics may take a while.