Fig. 3
Download original image
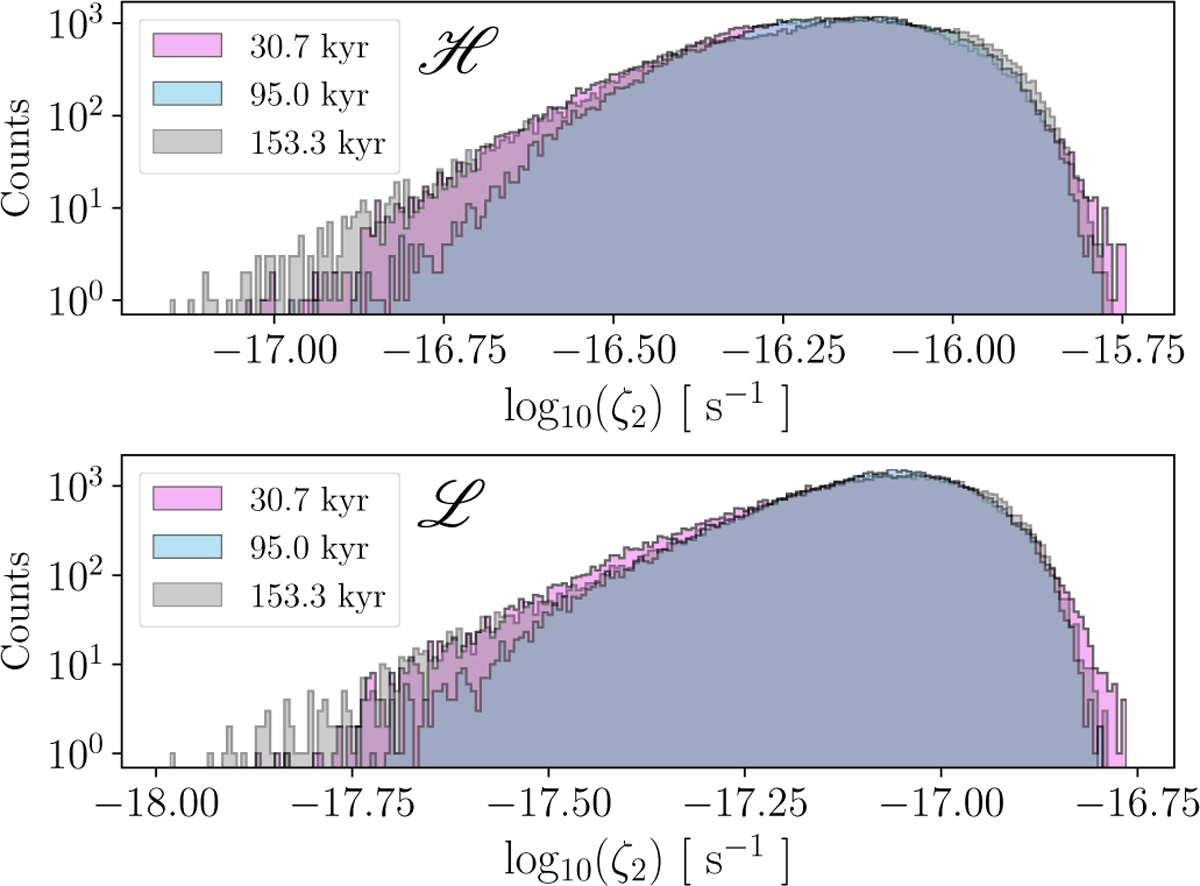
Time evolution of the distribution of ζ2 for the gas particles in the simulation for models ℋ (top) and ℒ (bottom). The distributions are determined from a box of 0.2 × 0.2 × 0.2 pc3, which only includes particles from the simulated cloud, i.e., with identical mass. The rightmost edge of the distribution shrinks over time as the gas particles within the box become denser. The low-end tail of the distribution expands towards lower ionisation rates, which is consistent with the evolution of the gas density.
Current usage metrics show cumulative count of Article Views (full-text article views including HTML views, PDF and ePub downloads, according to the available data) and Abstracts Views on Vision4Press platform.
Data correspond to usage on the plateform after 2015. The current usage metrics is available 48-96 hours after online publication and is updated daily on week days.
Initial download of the metrics may take a while.