Fig. 2
Download original image
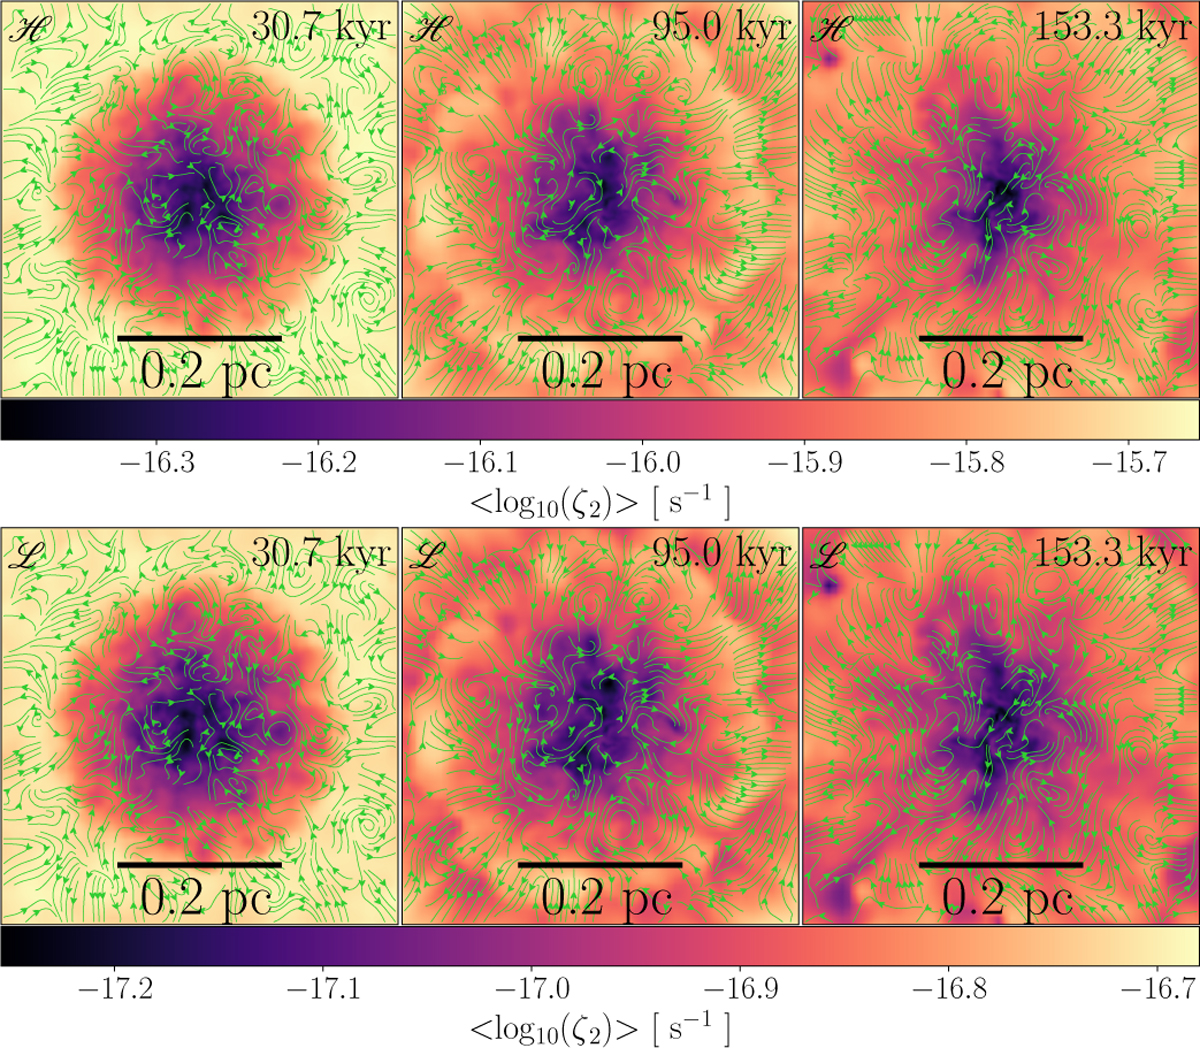
Time evolution of the density-weighted ζ2 for models ℋ (top panels) and ℒ (bottom panels) in a sphere of 0.5 pc radius, inside which CRs are propagated. The green arrows correspond to the x-y projection of the magnetic field lines. The two different models yield a difference of one order of magnitude within the high-density region.
Current usage metrics show cumulative count of Article Views (full-text article views including HTML views, PDF and ePub downloads, according to the available data) and Abstracts Views on Vision4Press platform.
Data correspond to usage on the plateform after 2015. The current usage metrics is available 48-96 hours after online publication and is updated daily on week days.
Initial download of the metrics may take a while.