Fig. 1
Download original image
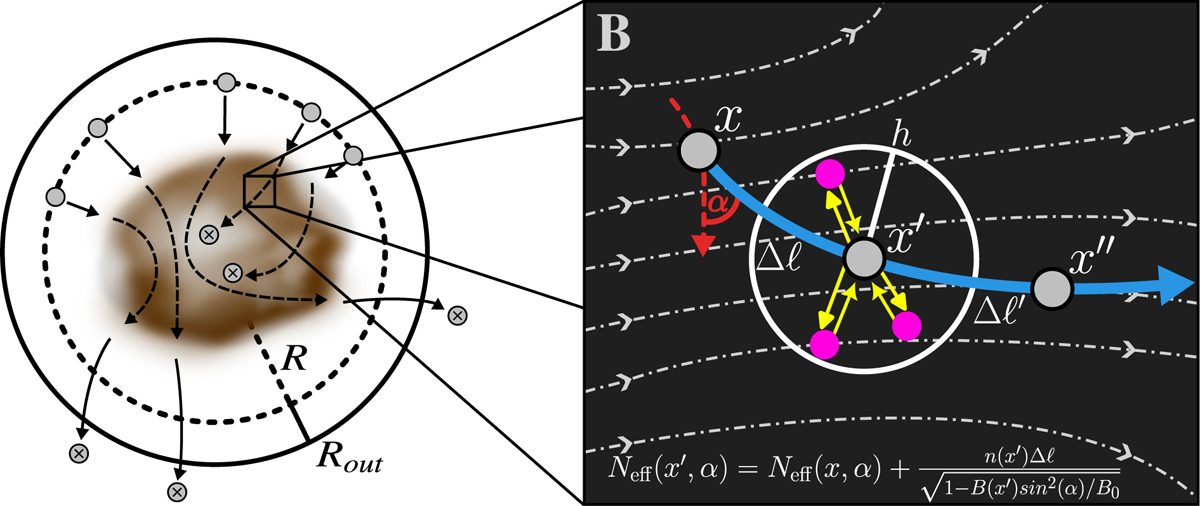
Sketch of the CR propagation scheme based on the structure given in Section 2.1. The left panel describes the TP propagation through the domain. TPs (grey dots) are created from a spherical surface of radius R (dashed black circle) with radial inward trajectories (step i). TPs are then deactivated when the column density that is traversed exceeds 1029 cm−2 or when they leave the outer spherical surface at a distance Rout (solid black circle), as shown by the crossed grey dots. The right panel instead highlights the propagation of a single TP particle. The trajectory is shown by the curved solid blue arrow, and the magnetic field lines (B) are reported as dash-dotted grey lines. The pitch angle (α) between the TP velocity and the local magnetic field is shown as the dashed red line. The displacement of the TP between the previous (x) and the current (x′) location is defined by the step size Δℓ (step iii). To compute the effective column density of the TP, the average local density (n(x′)) and local magnetic field (B(x′)) were estimated from gas particles (pink dots) within the kernel size h (thin yellow arrows; step ii). Then, its value was used to update the CR ionisation rate (ζ2; step iv), which was finally deposited at the location of the original gas particle (thick yellow arrows; step v).
Current usage metrics show cumulative count of Article Views (full-text article views including HTML views, PDF and ePub downloads, according to the available data) and Abstracts Views on Vision4Press platform.
Data correspond to usage on the plateform after 2015. The current usage metrics is available 48-96 hours after online publication and is updated daily on week days.
Initial download of the metrics may take a while.