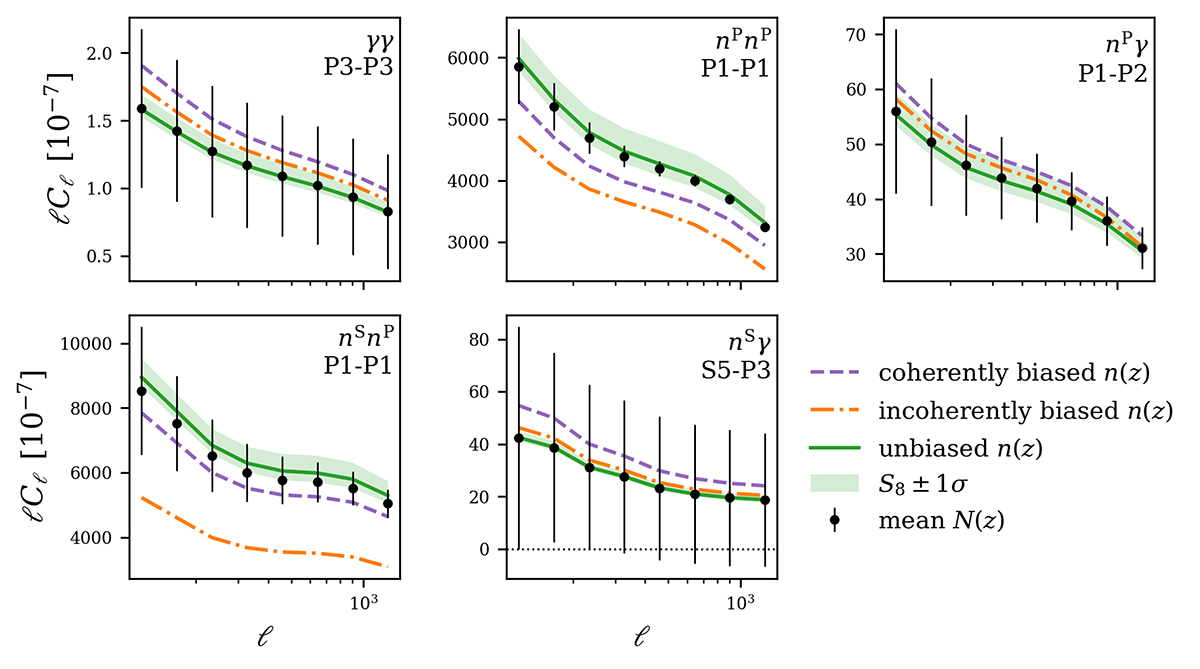
Fig. 9.
Download original image
Illustration of tomographic two-point correlations that form a subset of the 6 × 2 pt data/theory-vectors employed in this work. Annotations in the top right of each panel give the spectrum type and tomographic sample pairing, for cosmic shear (γγ), photometric auto-clustering (nPnP), photometric GGL (nPγ), spectroscopic-photometric cross-galaxy-galaxy lensing (nSγ), and spectroscopic-photometric cross-clustering (nSnP) correlations. No spectroscopic auto-clustering correlations are shown, as they are independent of the photometric redshift distribution. Black points and errors give the correlations (Sect. 2.1) and root-diagonal of the Gaussian covariance (Sect. 2.5) computed for the ‘mean’ redshift distribution N(z) (taken as the public estimate from KiDS+VIKING-450; Hildebrandt et al. 2020; Wright et al. 2019 – see Sect. 3.1.1). Coloured curves then show the same correlations, now computed for different redshift distributions: ‘unbiased’ (green, with shading indicating a ±1σ shift in the S8 parameter, holding all else constant); ‘incoherently biased’ (dash-dotted orange); and ‘coherently biased’ (dashed purple). The differences between these curves reflect the sensitivity – to the n(z) and to S8 – of the additional observables that we propose to employ for enhanced internal recalibration of photometric redshift distributions via nuisance models. We note that the positions of coloured curves relative to black points change as a function of redshift pairings across each angular power spectrum, and we are only showing a subset here.
Current usage metrics show cumulative count of Article Views (full-text article views including HTML views, PDF and ePub downloads, according to the available data) and Abstracts Views on Vision4Press platform.
Data correspond to usage on the plateform after 2015. The current usage metrics is available 48-96 hours after online publication and is updated daily on week days.
Initial download of the metrics may take a while.