Fig. 6.
Download original image
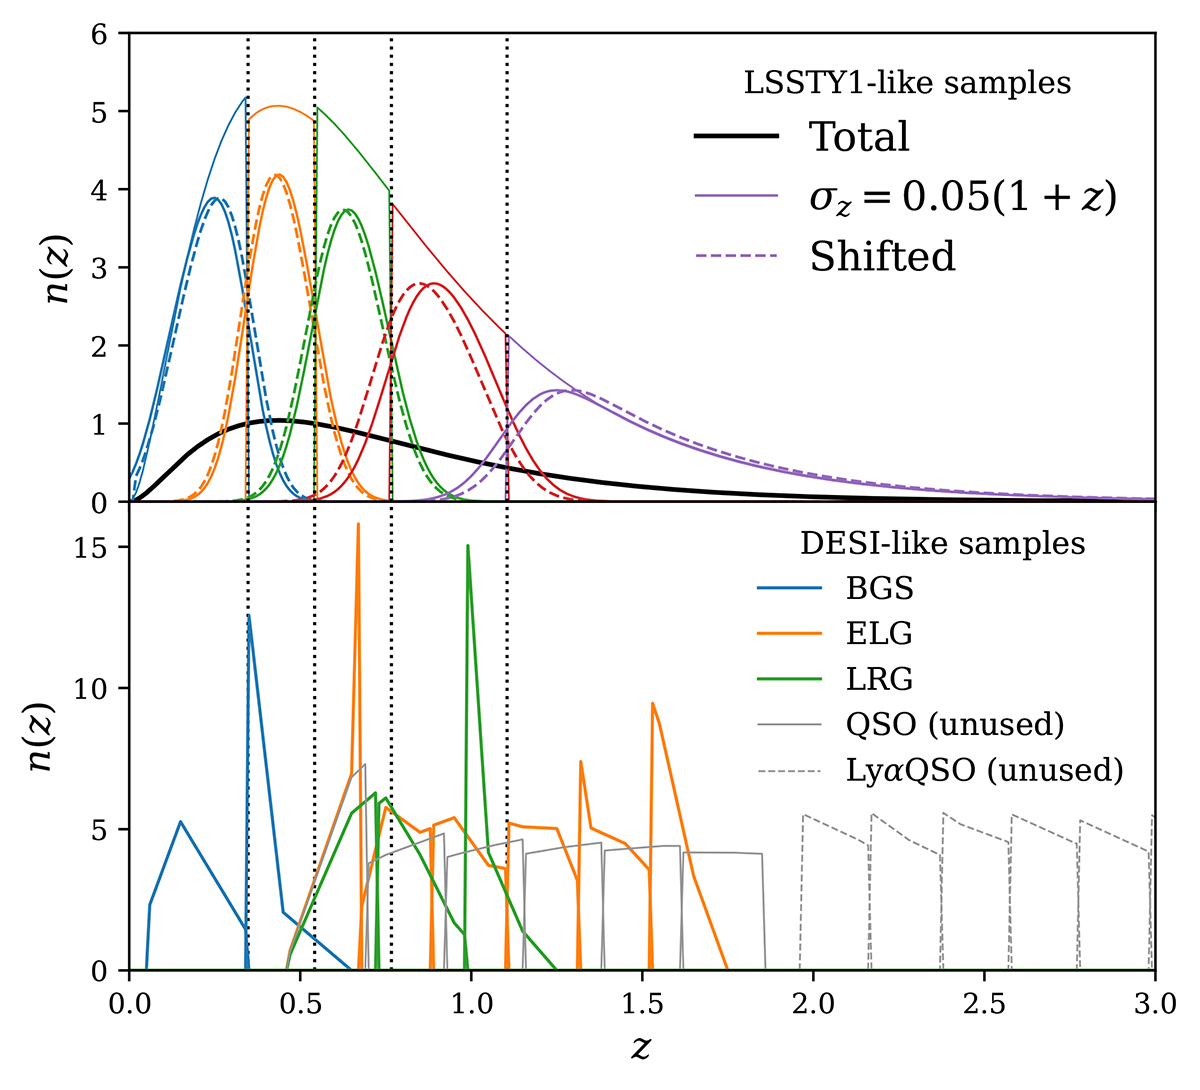
Redshift distributions assumed for our stage IV synthetic galaxy samples, with LSST year-1-like photometric tomography (top; Sect. 3.2.1), supplemented by DESI-like spectroscopic galaxy samples (bottom; Sect. 3.2.2). Vertical dotted lines give the redshift edges where the full photometric redshift distribution (top panel; black curve) is cut into tomographic bins (hard-edged histograms). These distributions are convolved with Gaussian kernels of width σz = 0.05(1 + z) to produce the true redshift distributions (solid coloured curves), and then displaced with randomly drawn shifts, δzi, as ![]() to define the ‘shifted’ distributions (dashed coloured curves). Apparent small overlaps of similarly coloured histograms in the bottom panel are plotting artifacts.
to define the ‘shifted’ distributions (dashed coloured curves). Apparent small overlaps of similarly coloured histograms in the bottom panel are plotting artifacts.
Current usage metrics show cumulative count of Article Views (full-text article views including HTML views, PDF and ePub downloads, according to the available data) and Abstracts Views on Vision4Press platform.
Data correspond to usage on the plateform after 2015. The current usage metrics is available 48-96 hours after online publication and is updated daily on week days.
Initial download of the metrics may take a while.