Fig. 20.
Download original image
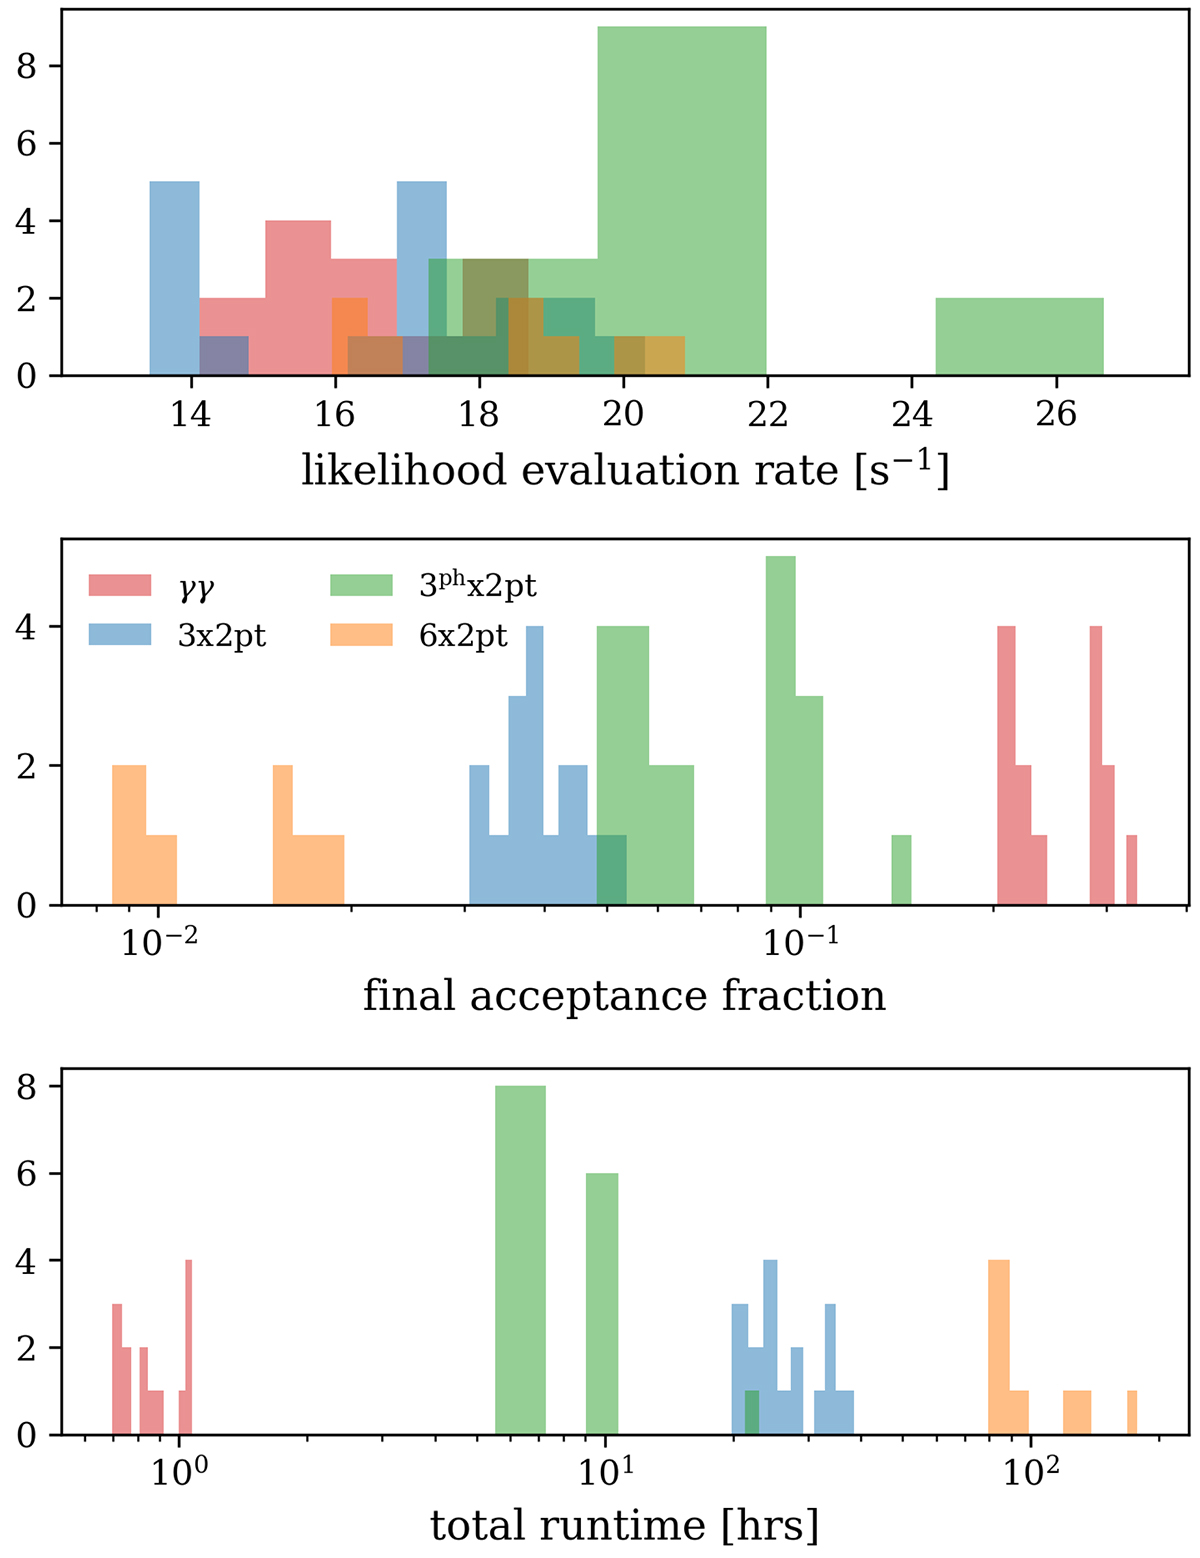
Histograms showing the number of likelihood evaluations per second (top), the final accepted fraction of evaluations (middle), and the total forecast run-time in hours (bottom) of our stage III forecasts, coloured according to the probe configurations (as in previous figures, and also given in the legend; see Table 2). We note that these are indicative estimates for runtimes, excluding some forecasts that were rerun at later stages, and including some variability stemming from the number of parallel threads utilized for each specific forecast. As a result, some forecast timings were unrepresentative (< 10 evaluations s−1), and these are not shown.
Current usage metrics show cumulative count of Article Views (full-text article views including HTML views, PDF and ePub downloads, according to the available data) and Abstracts Views on Vision4Press platform.
Data correspond to usage on the plateform after 2015. The current usage metrics is available 48-96 hours after online publication and is updated daily on week days.
Initial download of the metrics may take a while.