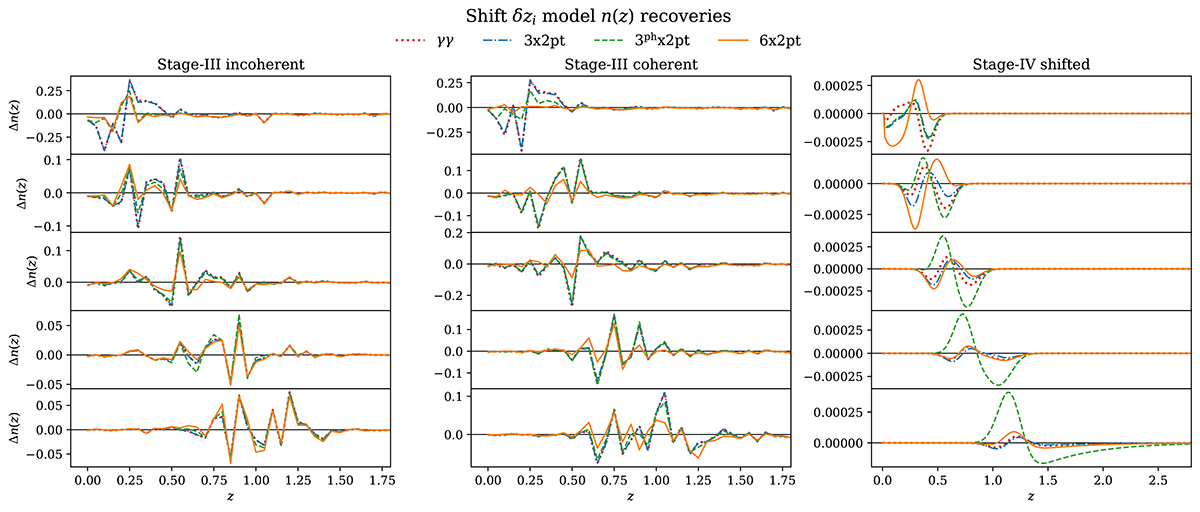
Fig. 17.
Download original image
Residual five-bin (rows, 1–5 descending) tomographic redshift distribution errors, Δn(z), found for the best-fit (MAP) shift models (Sect. 2.2) constrained by each of our stage III and stage IV redshift-biased forecasts (see Table 2 for a summary of configurations). Colours and line-styles give the probe configurations as in previous figures (except γγ, indicated here by dotted curves for clarity; see legend). For the stage III configuration, columns show the attempted recoveries of the incoherently (left) and coherently (middle) biased redshift distributions (Sect. 3.1.1), which feature full-shape n(z) deviations. For the stage IV configurations (right), the shifted distribution features pure shifts in the tomographic means (Sect. 3.2.1). The shift model enjoys generally superior recoveries of the true n(z) upon inclusion of spectroscopic-photometric cross-clustering correlations within the 6 × 2 pt configurations. We note that the pure-shift biases examined for the stage IV forecasts are well compensated for (residual errors are at the sub-percent level), and that the shift model offers a comparatively more accurate treatment of these stage IV biases than the full-shape n(z) errors in the stage III forecasts, where the largest residuals exceed 100%.
Current usage metrics show cumulative count of Article Views (full-text article views including HTML views, PDF and ePub downloads, according to the available data) and Abstracts Views on Vision4Press platform.
Data correspond to usage on the plateform after 2015. The current usage metrics is available 48-96 hours after online publication and is updated daily on week days.
Initial download of the metrics may take a while.