Fig. 16.
Download original image
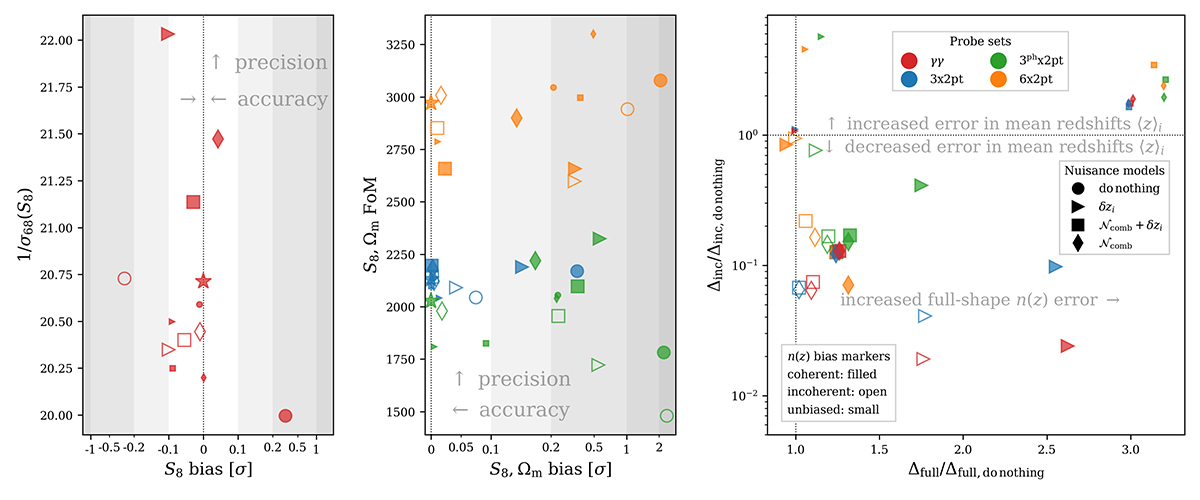
Summary statistics describing the accuracy and precision of the cosmological parameter inference, and corresponding recovery of the true redshift distribution via internal recalibration, for each of our stage III forecast configurations. Colours denote different probe sets, whilst marker-styles give the form of the redshift bias and the applied redshift nuisance model (legends in right panel; star markers denote the ![]() case for each probe set). Left and middle: Accuracy and precision of the cosmological constraints given in terms of the S8 bias and inverse σ68 for shear-only (left), and the two-dimensional parameter bias and the FoM (Sect. 4) on the S8 − Ωm plane for other probe sets (middle). Biases are given relative to the idealized case for each respective probe set (see Eq. (4.2) for the 2-d bias). The x-axes (S8 or S8 − Ωm bias) scale linearly between 0 and |0.2σ|, and logarithmically thereafter. Right: The n(z) recovery is characterized by the redshift distribution bias metrics Δfull and Δincoherent defined in Sect. 3.1.1 (Eqs. (3.1) and (3.2)). Each describes the deviance of the recovered n(z) with respect to the true distribution (
case for each probe set). Left and middle: Accuracy and precision of the cosmological constraints given in terms of the S8 bias and inverse σ68 for shear-only (left), and the two-dimensional parameter bias and the FoM (Sect. 4) on the S8 − Ωm plane for other probe sets (middle). Biases are given relative to the idealized case for each respective probe set (see Eq. (4.2) for the 2-d bias). The x-axes (S8 or S8 − Ωm bias) scale linearly between 0 and |0.2σ|, and logarithmically thereafter. Right: The n(z) recovery is characterized by the redshift distribution bias metrics Δfull and Δincoherent defined in Sect. 3.1.1 (Eqs. (3.1) and (3.2)). Each describes the deviance of the recovered n(z) with respect to the true distribution (![]() for open points,
for open points, ![]() for filled points, or
for filled points, or ![]() for small points) via a Euclidean distance, with Δfull computed over the full n(z) shapes, and Δincoherent computed between the 5-vectors of tomographic mean redshifts. These are given after the respective normalization to Δincoherent and Δfull found for the ‘do nothing’ model (Table 2), corresponding to circles in the left and middle panels. Circles and stars are not shown in the right panel for the ‘do nothing’ model, where each would sit at the centre of the dotted cross-hair. The spread of points shows that maximal parameter accuracy (towards zero in the left panel, and leftwards in the middle panel) and precision (upwards in the left and middle panels) most often come from a balance between reductions in Δincoherent and minimal increases in Δfull (towards the bottom left in the right panel), and that this is most achievable through use of the comb model (squares and diamonds), particularly for configurations that probe photometric densities (green and orange).
for small points) via a Euclidean distance, with Δfull computed over the full n(z) shapes, and Δincoherent computed between the 5-vectors of tomographic mean redshifts. These are given after the respective normalization to Δincoherent and Δfull found for the ‘do nothing’ model (Table 2), corresponding to circles in the left and middle panels. Circles and stars are not shown in the right panel for the ‘do nothing’ model, where each would sit at the centre of the dotted cross-hair. The spread of points shows that maximal parameter accuracy (towards zero in the left panel, and leftwards in the middle panel) and precision (upwards in the left and middle panels) most often come from a balance between reductions in Δincoherent and minimal increases in Δfull (towards the bottom left in the right panel), and that this is most achievable through use of the comb model (squares and diamonds), particularly for configurations that probe photometric densities (green and orange).
Current usage metrics show cumulative count of Article Views (full-text article views including HTML views, PDF and ePub downloads, according to the available data) and Abstracts Views on Vision4Press platform.
Data correspond to usage on the plateform after 2015. The current usage metrics is available 48-96 hours after online publication and is updated daily on week days.
Initial download of the metrics may take a while.