Fig. 11.
Download original image
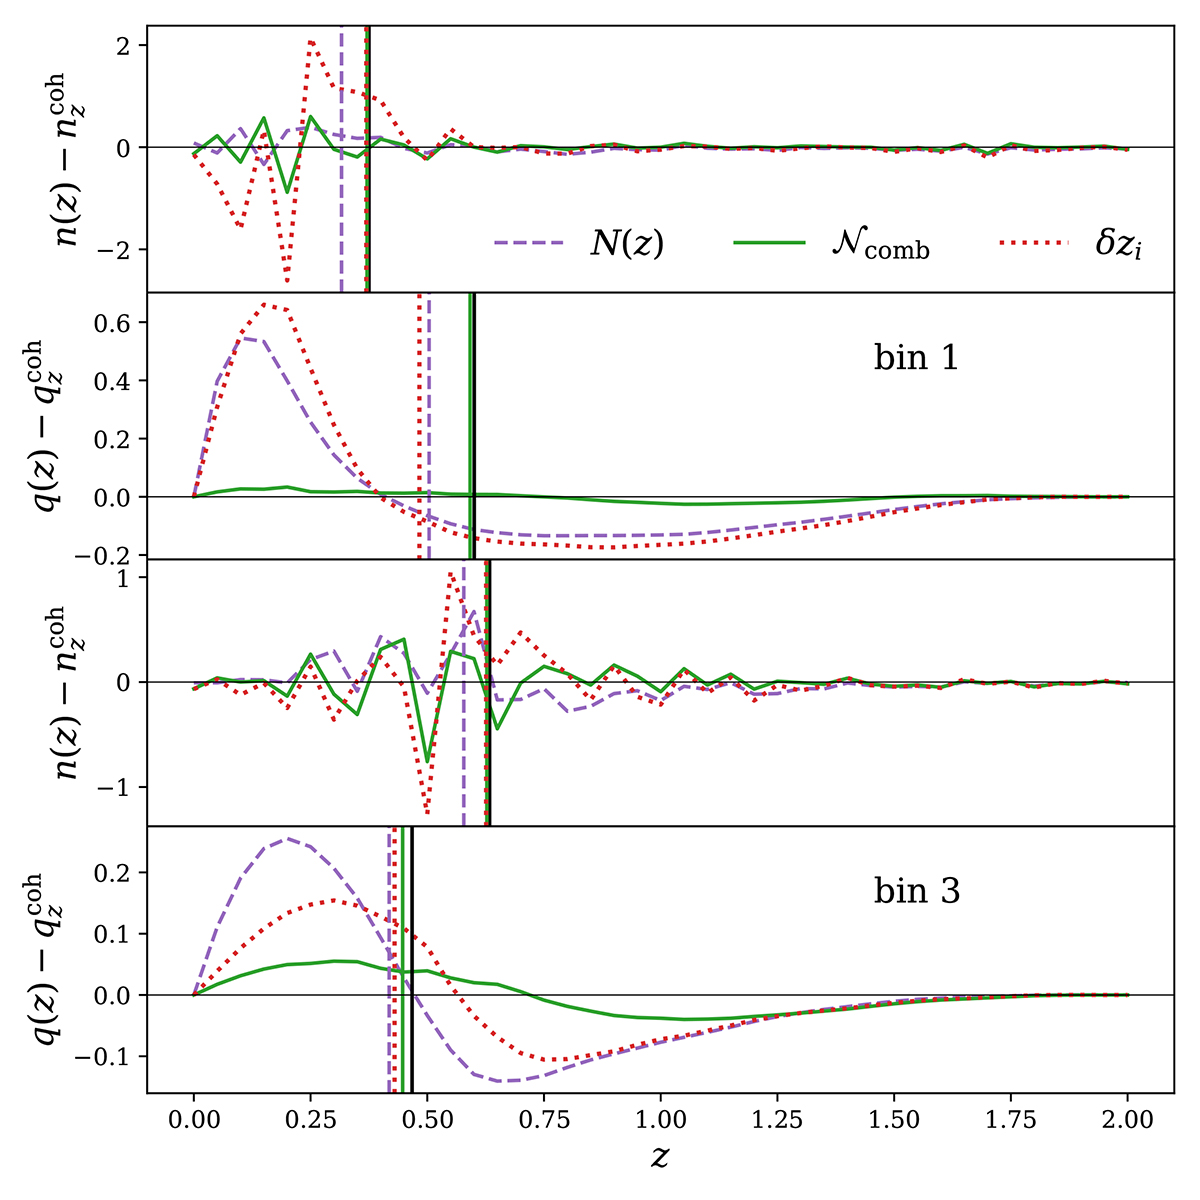
Illustration of the application of redshift nuisance models to the first and third bins of the ![]() biased stage III photometric redshift distribution (Fig. 4). Alternating panels give the target distribution
biased stage III photometric redshift distribution (Fig. 4). Alternating panels give the target distribution ![]() , or its corresponding lensing efficiency kernel
, or its corresponding lensing efficiency kernel ![]() , subtracted from the equivalent n(z) or q(z) seen under the various recalibration models: the ‘do nothing’ model, denoted as N(z) (dashed purple), the comb model 𝒩comb (solid green), and the shift model δzi (dotted red). The latter two are calibrated here against the 3 × 2 pt data-vector. Vertical lines give the mean of each n(z) or q(z). The optimized comb model corresponds to a flexible recalibration of the n(z), which minimizes the difference (via Eq. (2.23)) between the theory- and data-vector (e.g. Fig. 9) by varying the amplitudes of a Gaussian mixture model. One sees that the comb model outperforms the shift model in reducing errors in q(z) whilst minimally increasing errors in n(z).
, subtracted from the equivalent n(z) or q(z) seen under the various recalibration models: the ‘do nothing’ model, denoted as N(z) (dashed purple), the comb model 𝒩comb (solid green), and the shift model δzi (dotted red). The latter two are calibrated here against the 3 × 2 pt data-vector. Vertical lines give the mean of each n(z) or q(z). The optimized comb model corresponds to a flexible recalibration of the n(z), which minimizes the difference (via Eq. (2.23)) between the theory- and data-vector (e.g. Fig. 9) by varying the amplitudes of a Gaussian mixture model. One sees that the comb model outperforms the shift model in reducing errors in q(z) whilst minimally increasing errors in n(z).
Current usage metrics show cumulative count of Article Views (full-text article views including HTML views, PDF and ePub downloads, according to the available data) and Abstracts Views on Vision4Press platform.
Data correspond to usage on the plateform after 2015. The current usage metrics is available 48-96 hours after online publication and is updated daily on week days.
Initial download of the metrics may take a while.