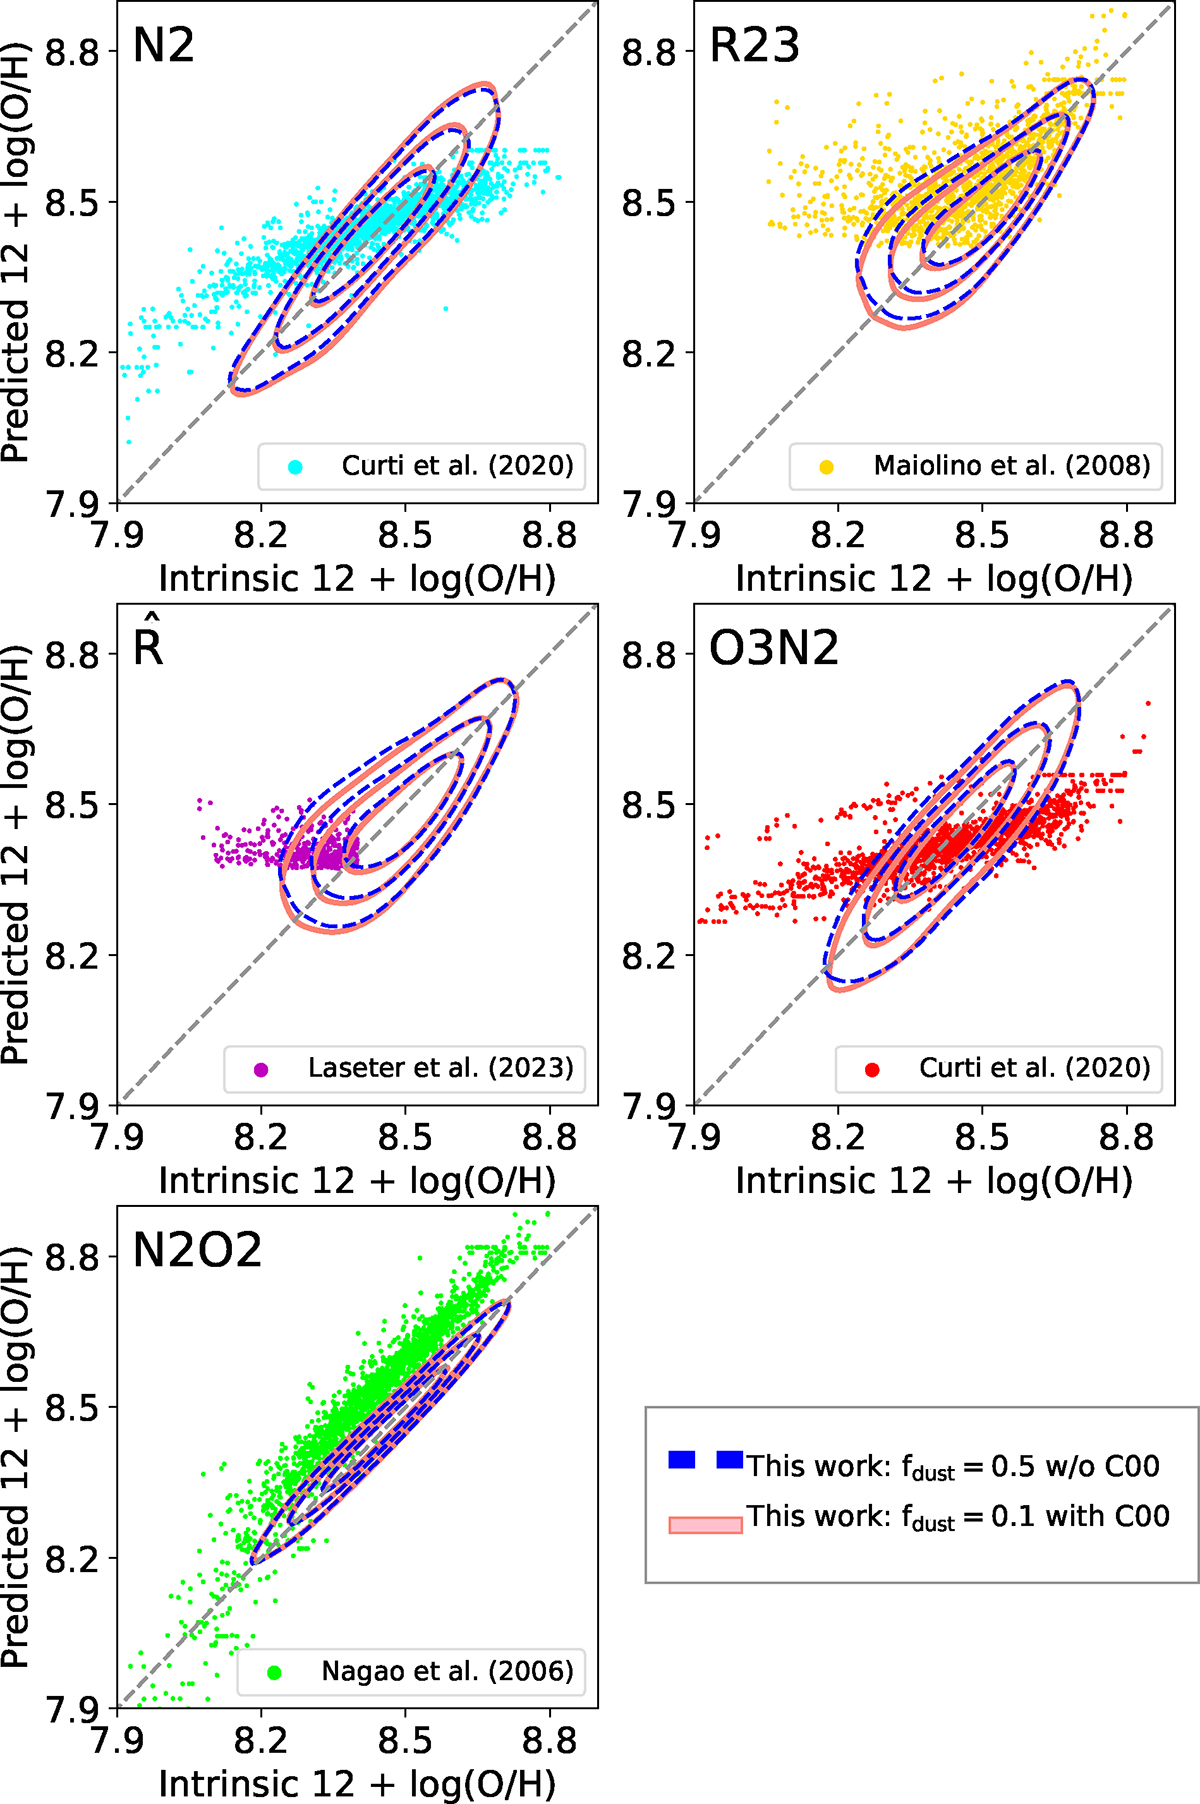
Fig. 8.
Download original image
Comparison between intrinsic gas-phase metallicities and values predicted from PRISMA spectra with fdust = 0.5 (blue contours) and with fdust = 0.1 and the Calzetti law (pink contours). The contours represent the density distributions of spaxels, where the inner, central and outer contours enclose the 30th, 50th, and 90th percentiles of the spaxels. The predicted abundances from the selected literature calibrations are also displayed (colored dots). The gray, dashed line depicts the 1:1 relation.
Current usage metrics show cumulative count of Article Views (full-text article views including HTML views, PDF and ePub downloads, according to the available data) and Abstracts Views on Vision4Press platform.
Data correspond to usage on the plateform after 2015. The current usage metrics is available 48-96 hours after online publication and is updated daily on week days.
Initial download of the metrics may take a while.