Fig. 7.
Download original image
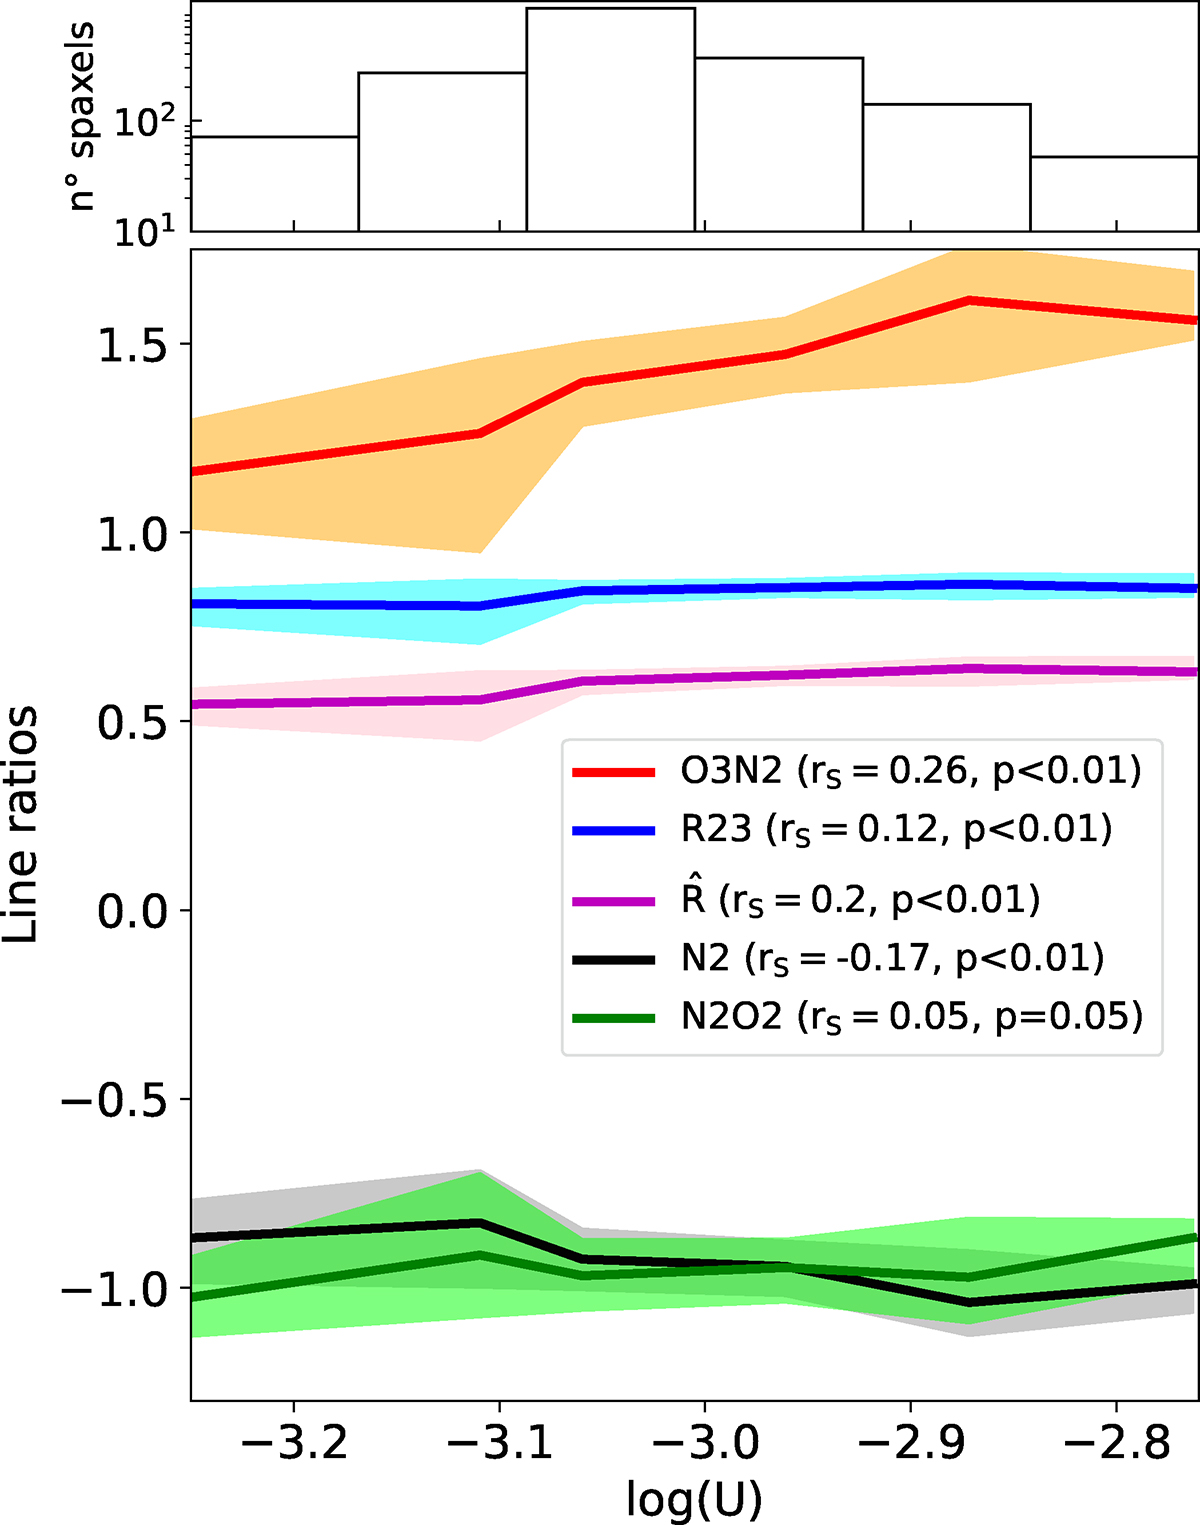
Lower panel: Median predicted N2, R23, ![]() , O3N2 and N2O2 as a function of the ionization parameter. The shaded regions indicate the interquartile range (25th–75th percentiles) of the line ratios in each ionization parameter bin. Additionally, we indicate the Spearman parameter (rS) and p-value for each indicator. Upper panel: Distribution of the median log(U) per spaxel.
, O3N2 and N2O2 as a function of the ionization parameter. The shaded regions indicate the interquartile range (25th–75th percentiles) of the line ratios in each ionization parameter bin. Additionally, we indicate the Spearman parameter (rS) and p-value for each indicator. Upper panel: Distribution of the median log(U) per spaxel.
Current usage metrics show cumulative count of Article Views (full-text article views including HTML views, PDF and ePub downloads, according to the available data) and Abstracts Views on Vision4Press platform.
Data correspond to usage on the plateform after 2015. The current usage metrics is available 48-96 hours after online publication and is updated daily on week days.
Initial download of the metrics may take a while.