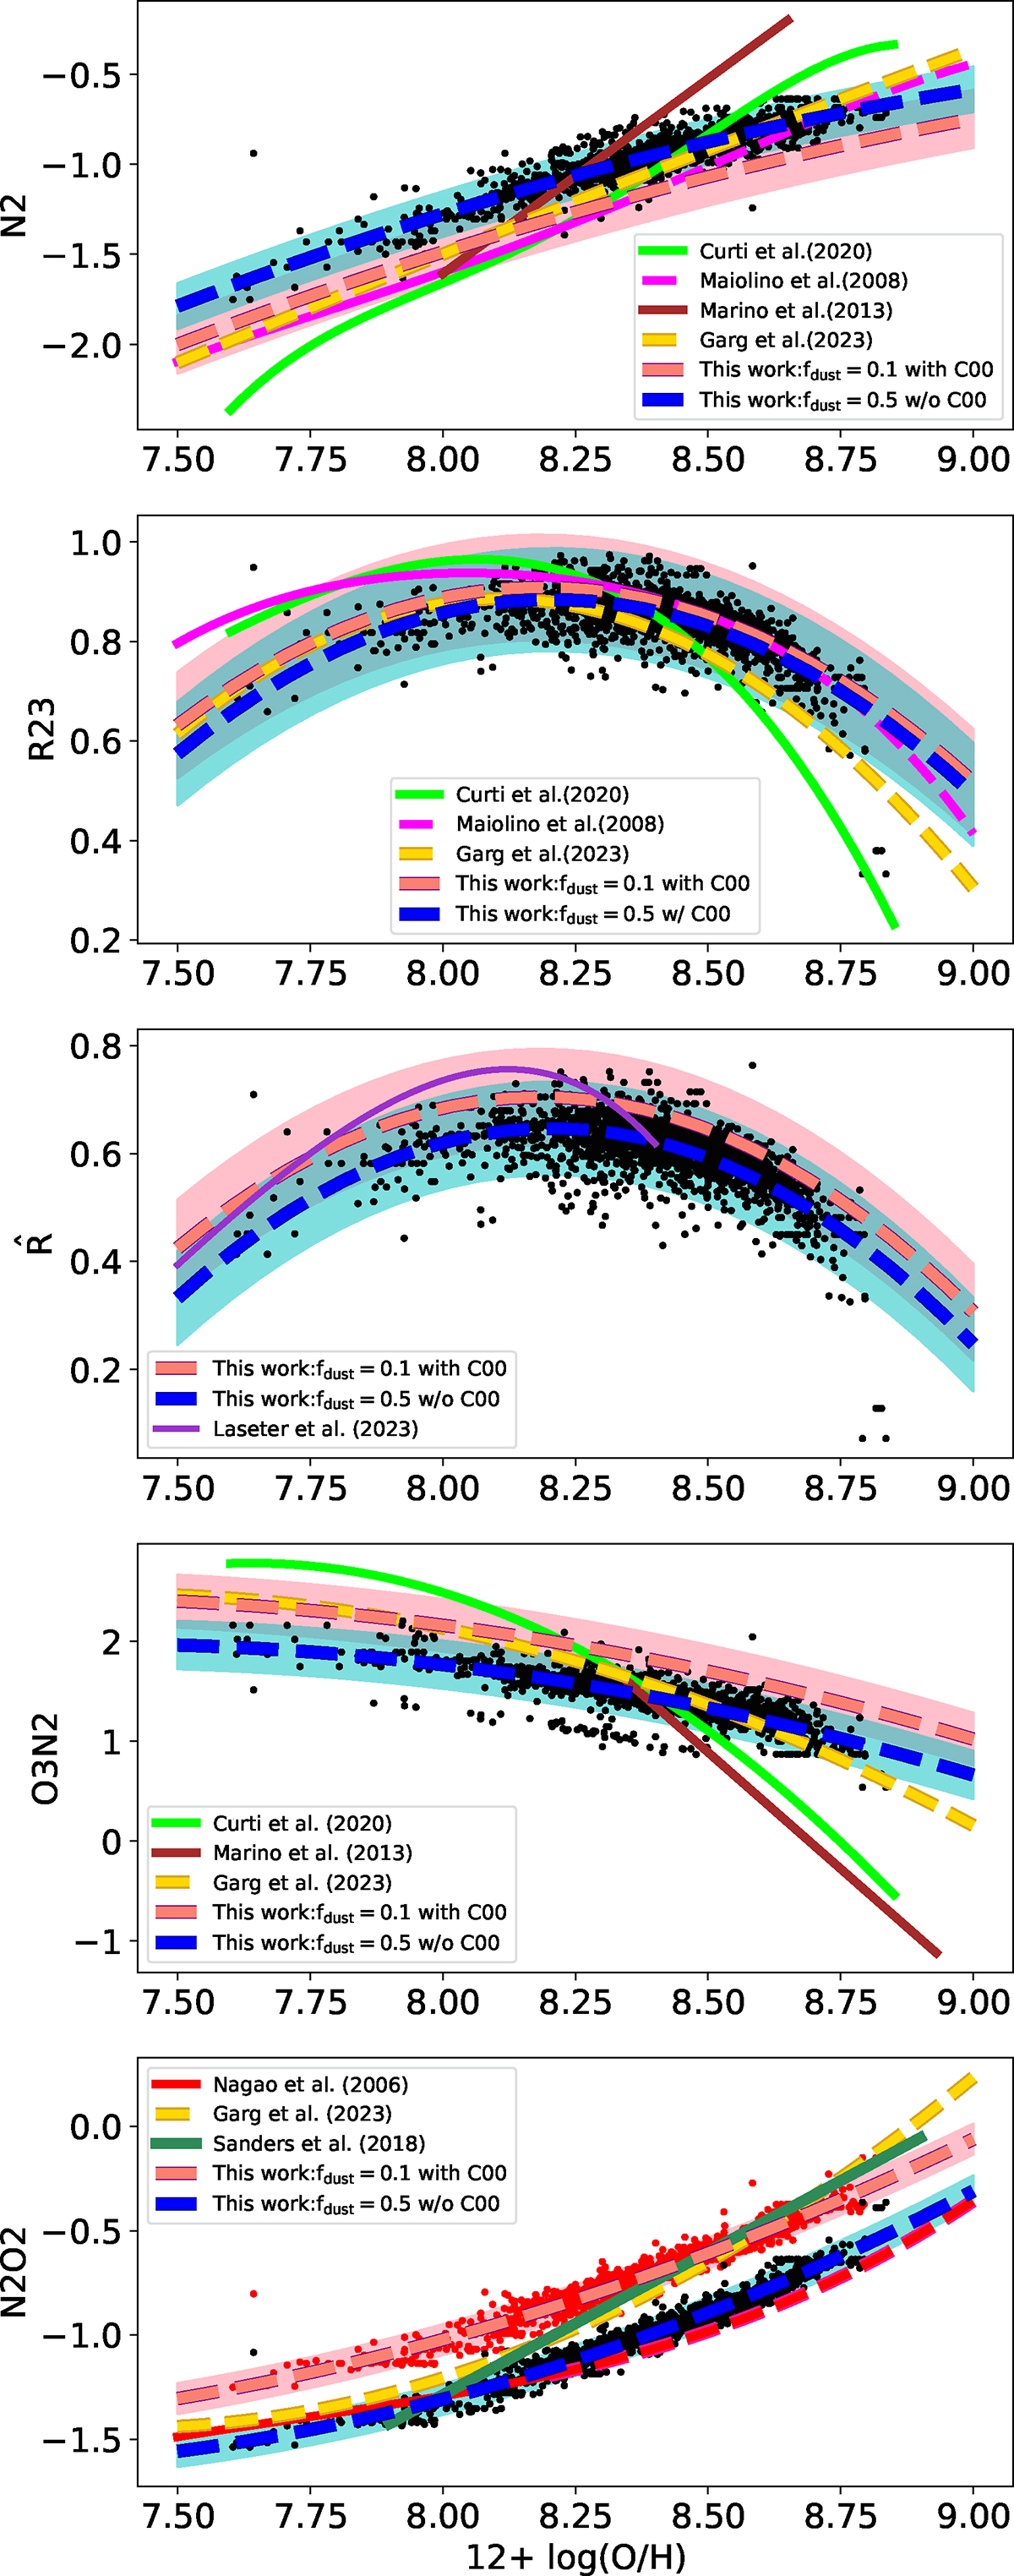
Fig. 6.
Download original image
Emission line ratios as a function of the intrinsic oxygen abundance for the sample data (black dots). The blue and pink dashed lines represent the best fits to the simulated data, considering synthetic spectra non-attenuated and attenuated by the Calzetti law, respectively. The shaded regions shows the 95% prediction intervals. The red dots in the last panel represent the attenuated data by the Calzetti law. The metallicity range of applicability of each literature calibration is reflected in the length of each relation.
Current usage metrics show cumulative count of Article Views (full-text article views including HTML views, PDF and ePub downloads, according to the available data) and Abstracts Views on Vision4Press platform.
Data correspond to usage on the plateform after 2015. The current usage metrics is available 48-96 hours after online publication and is updated daily on week days.
Initial download of the metrics may take a while.