Fig. 3.
Download original image
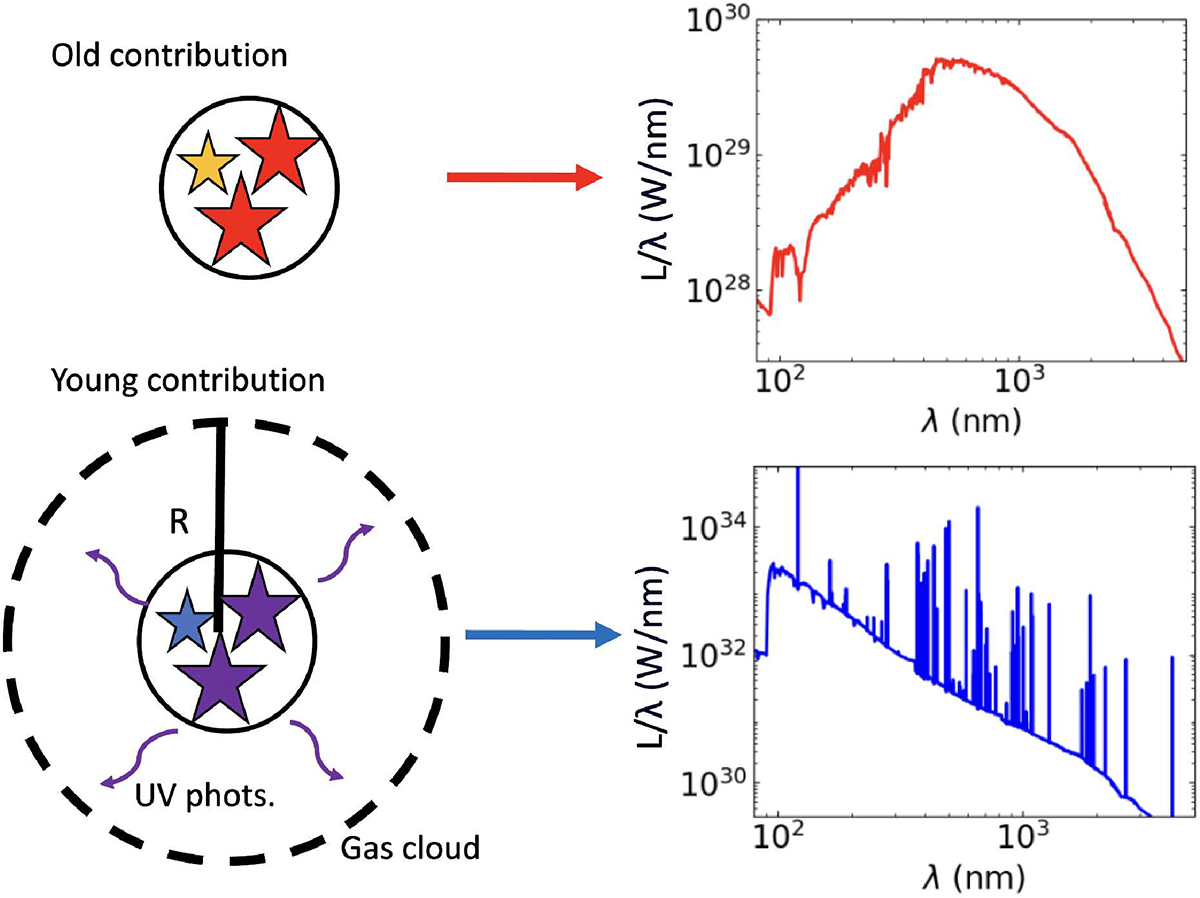
Diagram of the model we adopted to add the emission lines to the spectra in PRISMA. The inset top panel shows the spectrum produced by stellar populations older than 10 Myr, which only depends on the CB19 stellar population synthesis models. The inset bottom panel displays the spectrum produced by stellar populations, which includes the CB19 SED models, and incorporates the nebular emission that is produced by the ionized gas cloud, which is represented by a sphere of radius R.
Current usage metrics show cumulative count of Article Views (full-text article views including HTML views, PDF and ePub downloads, according to the available data) and Abstracts Views on Vision4Press platform.
Data correspond to usage on the plateform after 2015. The current usage metrics is available 48-96 hours after online publication and is updated daily on week days.
Initial download of the metrics may take a while.