Fig. 3.
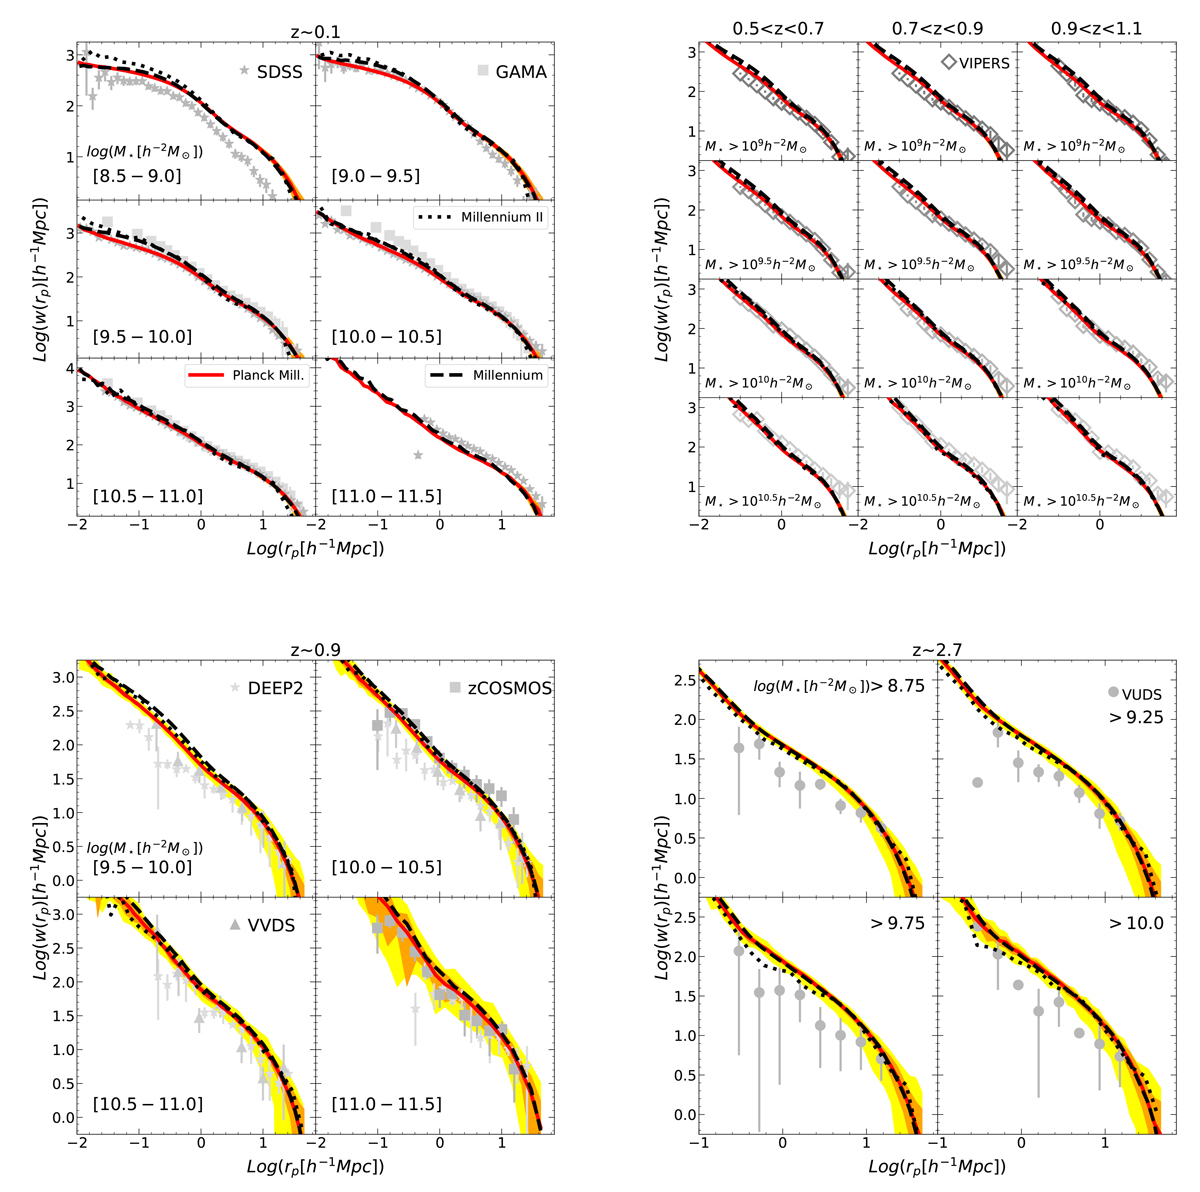
Download original image
Redshift evolution of the projected two-point correlation function at different bins of stellar mass (as labelled). Upper left: Data from SDSS at z ∼ 0 (Li et al. 2006). Upper right: Data from VIPERS at 0.5 < z < 1.1 (Marulli et al. 2013). Lower left: Data at z ∼ 0.9 from VVDS (Meneux et al. 2008), zCOSMOS (Meneux et al. 2009), DEEP2 obtained using the same techniques as in Li et al. (2006). Lower right: Data from VUDS at 2 < z < 3.5 (Durkalec et al. 2018). GAEA predictions refer to the realizations run on the MS (black dashed line) and on the PMS (red solid line) as in Fig. 2. The blue dot-dashed line refers to the 2pCF computed using the central galaxies belonging to DMHs in a mass range derived from the stellar mass range using the Behroozi et al. (2013) relation (see main text for details). The orange and yellow areas correspond to the jackknife estimated errors and cosmic variance dispersion, respectively.
Current usage metrics show cumulative count of Article Views (full-text article views including HTML views, PDF and ePub downloads, according to the available data) and Abstracts Views on Vision4Press platform.
Data correspond to usage on the plateform after 2015. The current usage metrics is available 48-96 hours after online publication and is updated daily on week days.
Initial download of the metrics may take a while.