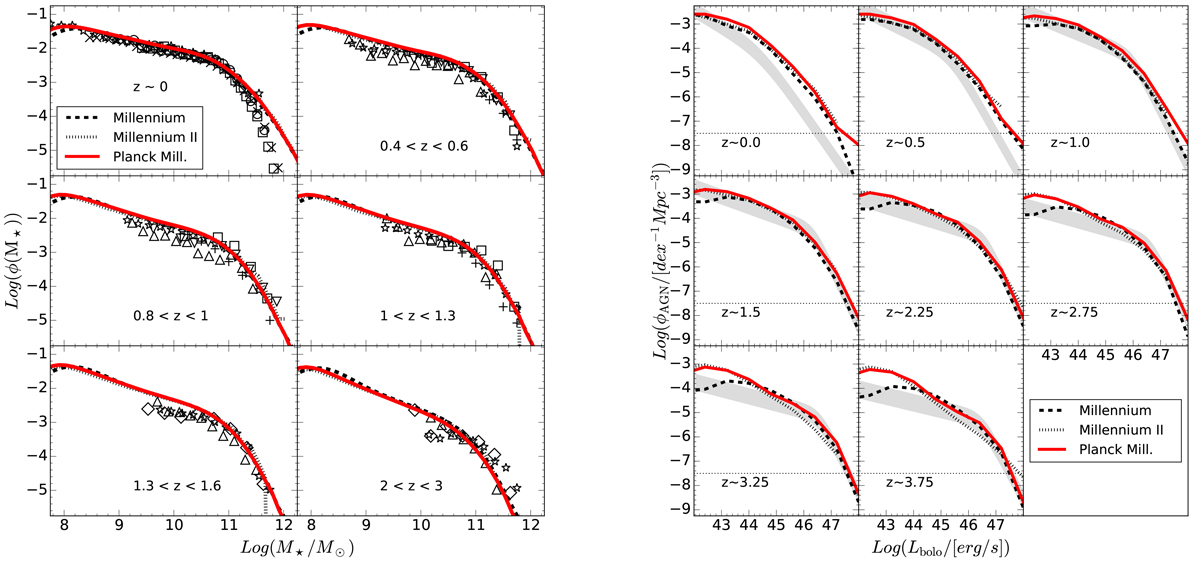
Fig. 2.
Download original image
Left: Redshift evolution of the galaxy stellar mass function, the data points correspond to the compilation used in Fontanot et al. (2009, see complete reference list for their Fig. 1). Right: Redshift evolution of the bolometric QSO/AGN-LF; the shaded regions show the expected space density from the empirical estimate of Shen et al. (2020). The black solid, black dashed, and red solid lines refer the GAEA model version presented in DL24 and run on the MS, MSII, and PMS simulations, respectively.
Current usage metrics show cumulative count of Article Views (full-text article views including HTML views, PDF and ePub downloads, according to the available data) and Abstracts Views on Vision4Press platform.
Data correspond to usage on the plateform after 2015. The current usage metrics is available 48-96 hours after online publication and is updated daily on week days.
Initial download of the metrics may take a while.