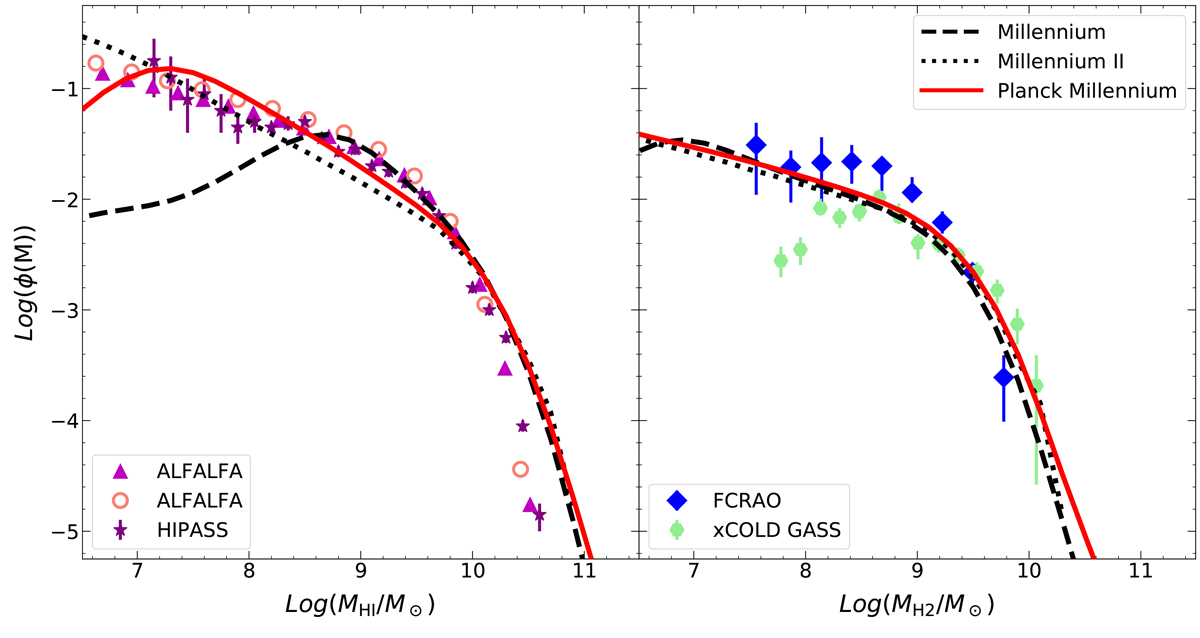
Fig. A.5.
Download original image
HI and H2 mass functions at z∼0 (left and right panel respectively). The observational data are from Keres et al. (2003, blue empty diamonds), Zwaan et al. (2005, purple stars), Haynes et al. (2011, magenta triangles), Jones et al. (2018, pink empty circles), and Fletcher et al. (2021, light green hexagons). The line types and colours are as in Fig. A.1. The model predictions have been convolved with an estimated 0.25 dex error on the gas mass determination.
Current usage metrics show cumulative count of Article Views (full-text article views including HTML views, PDF and ePub downloads, according to the available data) and Abstracts Views on Vision4Press platform.
Data correspond to usage on the plateform after 2015. The current usage metrics is available 48-96 hours after online publication and is updated daily on week days.
Initial download of the metrics may take a while.