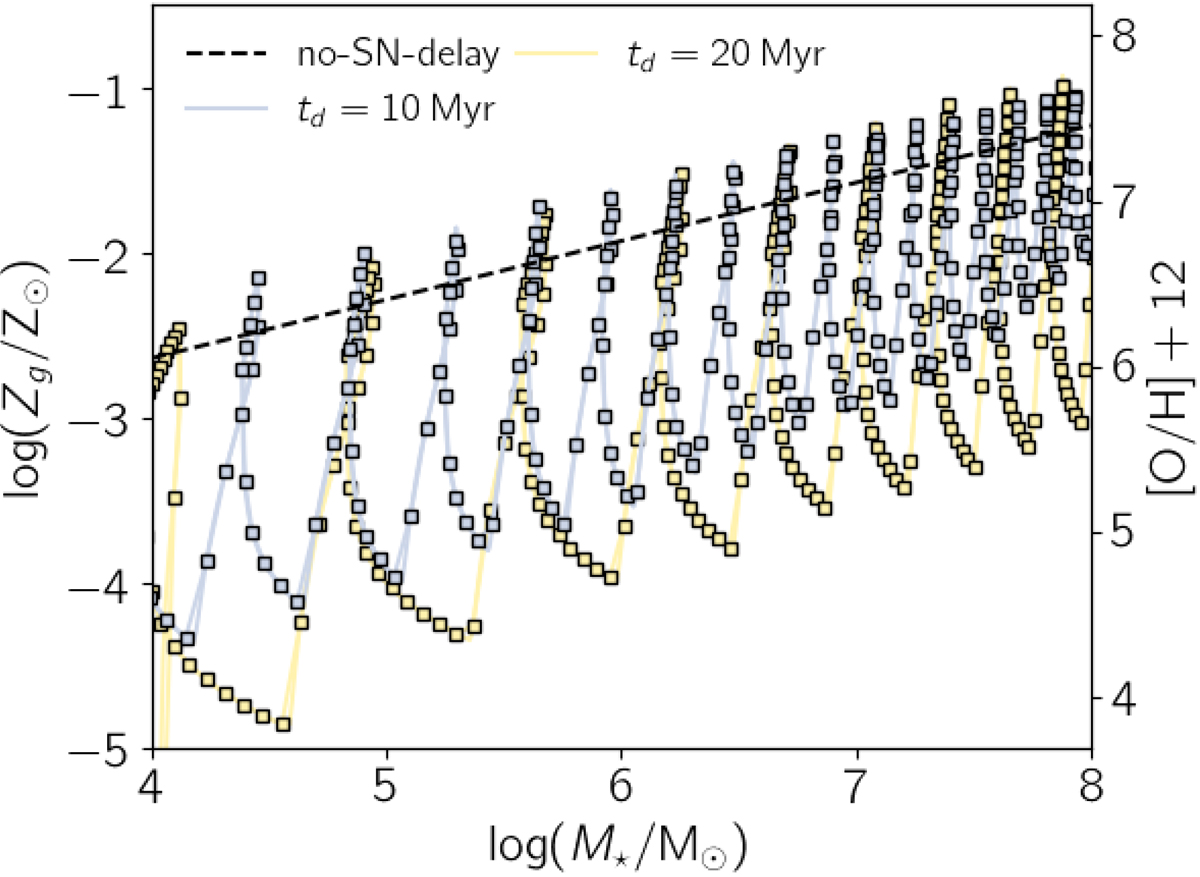
Fig. B.1.
Download original image
Impact of a coarse time sampling in determining the burstiness on the MZR for a system with Mdm = 3 × 10¹⁰ M⊙ at z = 6 evolved with our minimal physical model (cfr with Fig. 3). Different lines indicate different delay times for the SN feedback, as indicated in the legend. Squares (continuous lines) indicate a 2 Myr (0.2 Myr) time sampling. For visualization sake, the number of models is less than that present in Fig. 3.
Current usage metrics show cumulative count of Article Views (full-text article views including HTML views, PDF and ePub downloads, according to the available data) and Abstracts Views on Vision4Press platform.
Data correspond to usage on the plateform after 2015. The current usage metrics is available 48-96 hours after online publication and is updated daily on week days.
Initial download of the metrics may take a while.