Fig. 9.
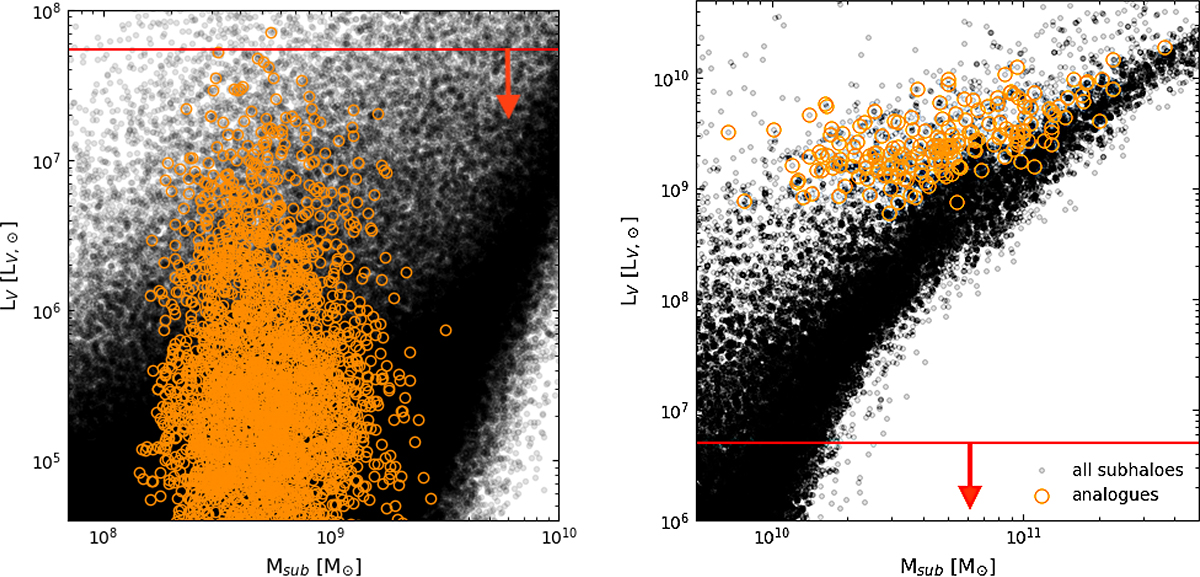
Download original image
Comparison of the luminosity of the simulated subhaloes and the observational limits set for the two detections. First, we selected the systems that best match the observational inference in terms of projected slope and enclosed mass: in practice, these were selected within the orange rectangles in the top panels of Fig. 8. We computed their luminosity, LV, from the V-band magnitudes provided in the TNG50-1 subhalo catalogue and plot them as orange circles as a function of the subhalo mass, Msub. We show the results for B1938+666 on the left and J0946+1006 on the right. The black dots show instead the luminosity of the general subhalo population at the same redshift. The observational upper limits (see Sect. 3) are represented by the horizontal red line in the plot.
Current usage metrics show cumulative count of Article Views (full-text article views including HTML views, PDF and ePub downloads, according to the available data) and Abstracts Views on Vision4Press platform.
Data correspond to usage on the plateform after 2015. The current usage metrics is available 48-96 hours after online publication and is updated daily on week days.
Initial download of the metrics may take a while.