Fig. 8.
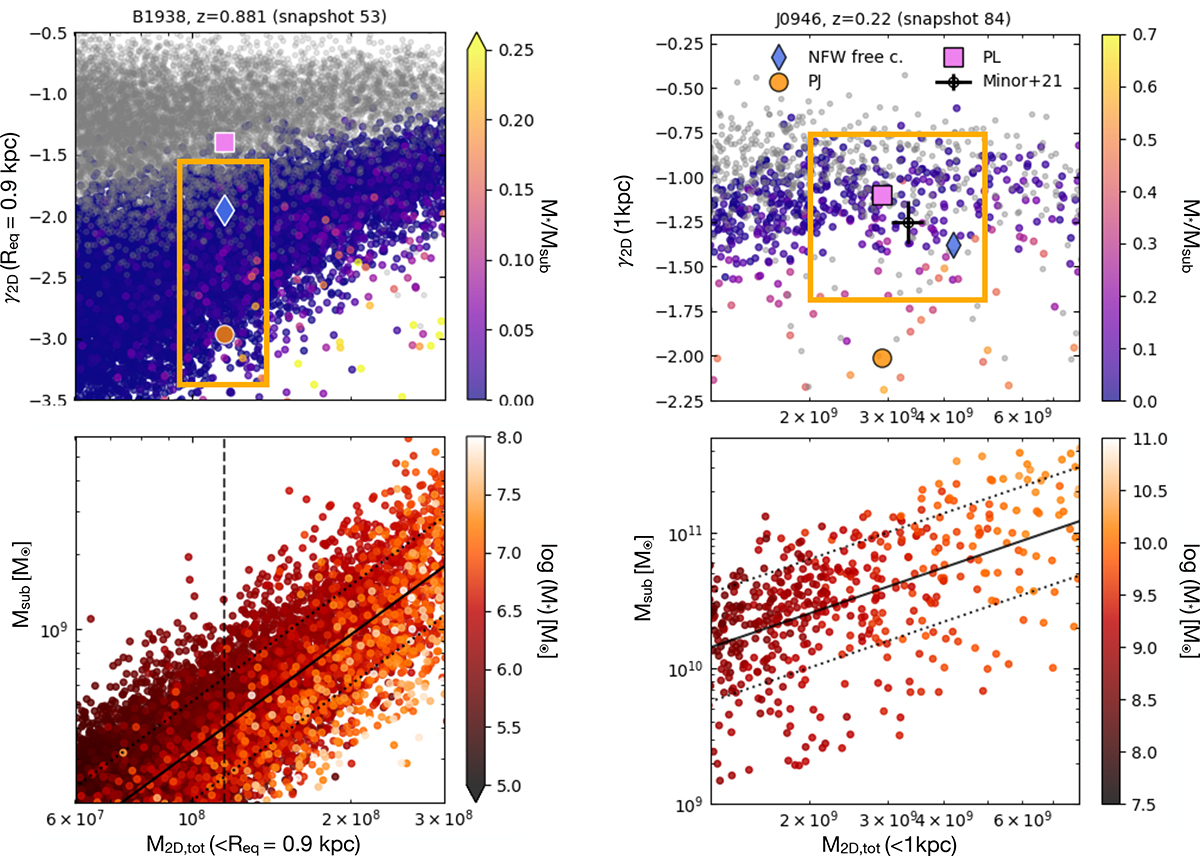
Download original image
Top: log-slope of the surface density profile around r=Req = 0.9 kpc (for B1938+666) or r = 1 kpc (for J0946+1006) against the projected total mass enclosed within the same distance. See Fig. 13 for the J0946+1006 results at r=Req, which we believe are affected by resolution. The coloured points indicate the top 10 percent of lines of sight that yielded the largest density values, colour-coded by the stellar-to-total mass ratio. The grey dots indicate the averages over all 1000 lines of sight. The larger points show the slope and mass values inferred from our lens modelling for the PJ (orange circle), NFW with free concentration (blue diamond) and PL (pink square) profiles. In the right panel, we also compare to the measurement by Minor et al. (2021). Bottom: total subhalo mass as a function of the enclosed projected mass. Points are coloured by the total stellar mass of the subhalo. The mean and standard deviation used in Equation (11) are represented by the solid and dotted black lines.
Current usage metrics show cumulative count of Article Views (full-text article views including HTML views, PDF and ePub downloads, according to the available data) and Abstracts Views on Vision4Press platform.
Data correspond to usage on the plateform after 2015. The current usage metrics is available 48-96 hours after online publication and is updated daily on week days.
Initial download of the metrics may take a while.