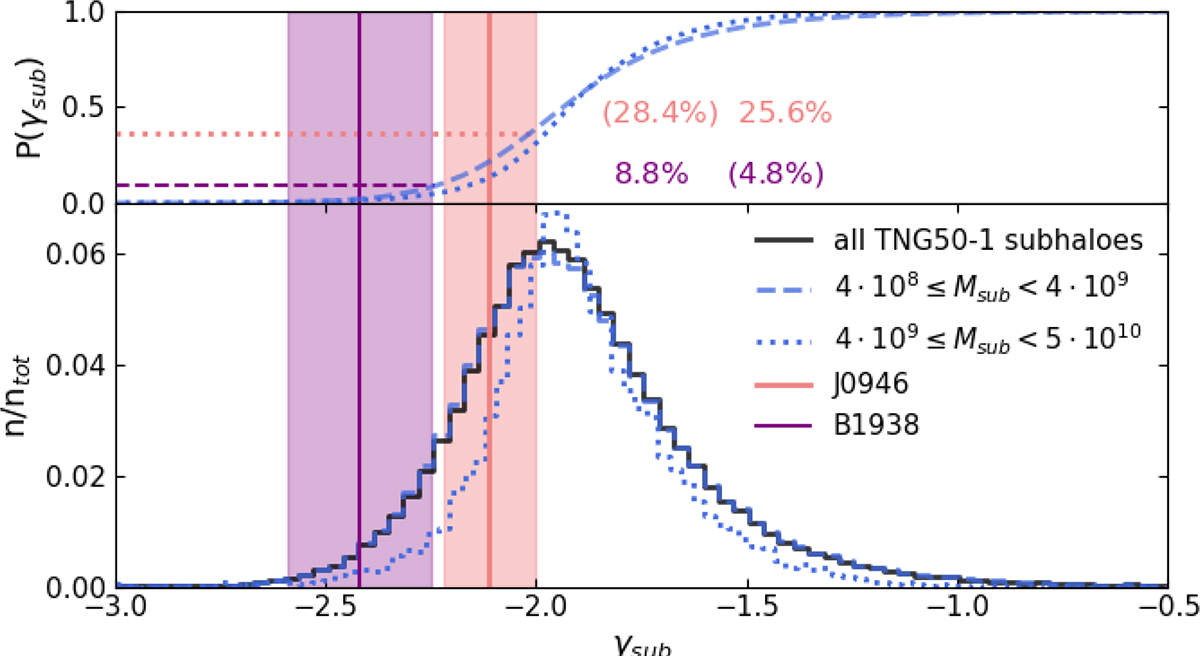
Fig. 7.
Download original image
Comparison between the γsub inferred from observations with the PL model (see Fig. 4) and the inner slopes of subhaloes from the TNG50-1 simulation. In the latter, the slope has been measured for all subhaloes in H23 (see their Fig. 9). The bottom panel shows the distribution of slopes of all subhaloes (black) and two mass bins roughly corresponding to the range of the detections. The coloured vertical lines and shaded areas correspond to the observed values (Table 2). In the top panel, we show the cumulative distribution for all subhaloes and the second mass bin, and we report the corresponding fractions of subhaloes that are compatible with the observed slopes in the two mass bins, highlighting the one that better corresponds to the detection in each case with the horizontal lines and corresponding numbers.
Current usage metrics show cumulative count of Article Views (full-text article views including HTML views, PDF and ePub downloads, according to the available data) and Abstracts Views on Vision4Press platform.
Data correspond to usage on the plateform after 2015. The current usage metrics is available 48-96 hours after online publication and is updated daily on week days.
Initial download of the metrics may take a while.