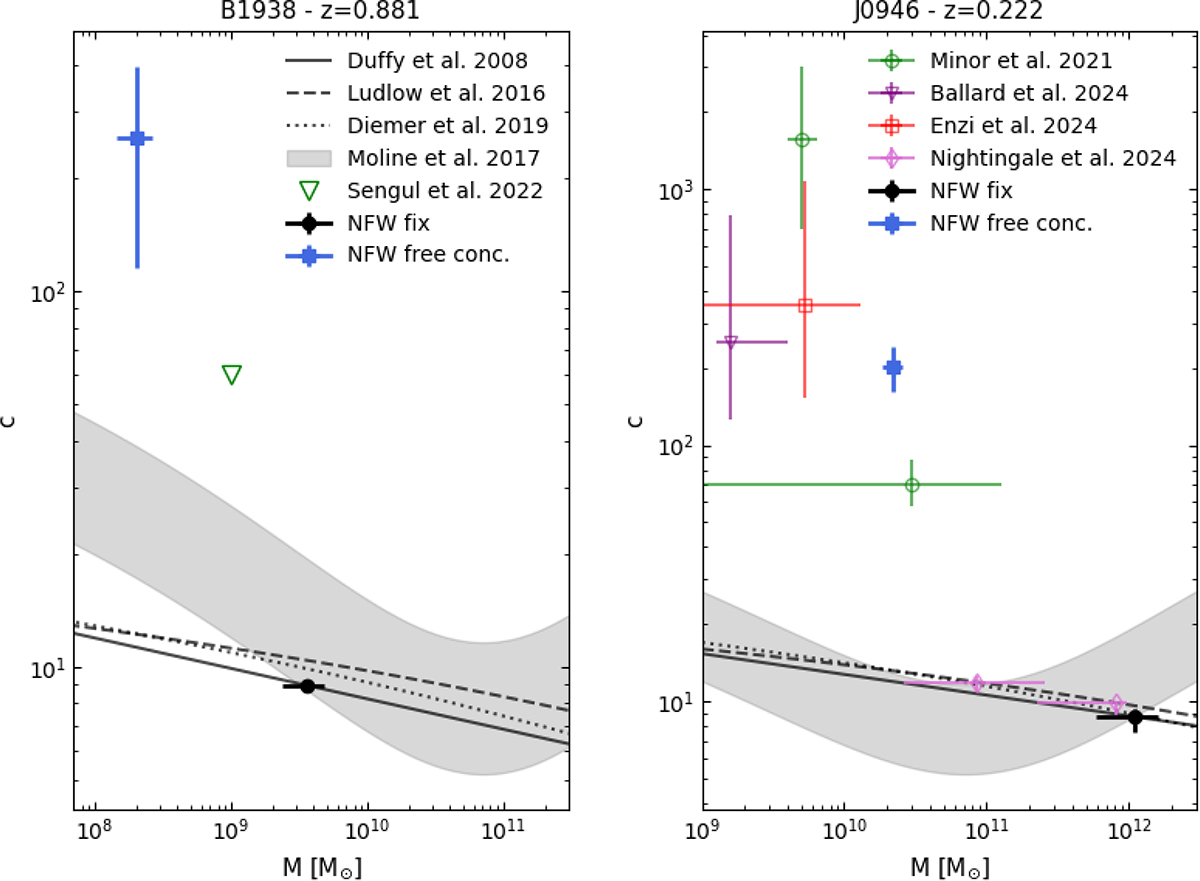
Fig. 5.
Download original image
Comparison of the NFW models from our analysis (black circles and blue squares) and previous works with concentration–mass–redshift relations derived from N-body simulations. All results are expressed in terms of the virial mass of haloes Mvir, except for Moliné et al. (2017) who measured the relation using M200, i.e. the mass within the radius enclosing an overdensity of 200. In this case, the relation has an additional dependence on the distance of the subhalo from the centre of its host halo. Since the observational results are derived in projection (on the lens plane), we cannot determine the three-dimensional distance from the host centre, and we plot a range of relations for distances between 0.1Rvir and Rvir. Given that it was calibrated on subhaloes rather than isolated haloes, it naturally predicts higher concentrations at the low-mass end. In each panel, the coloured symbols and error bars show our inferred values from the analysis of the observations (black circle and blue square) and the results from previous works (empty symbols), listed in Table 2. Şengül & Dvorkin (2022) used a fixed mass Msub = 109 M⊙ and varied the inner slope of the profile (that we report in the table), from which they estimated a corresponding concentration but did not provide uncertainties in this quantity.
Current usage metrics show cumulative count of Article Views (full-text article views including HTML views, PDF and ePub downloads, according to the available data) and Abstracts Views on Vision4Press platform.
Data correspond to usage on the plateform after 2015. The current usage metrics is available 48-96 hours after online publication and is updated daily on week days.
Initial download of the metrics may take a while.