Fig. 3.
Download original image
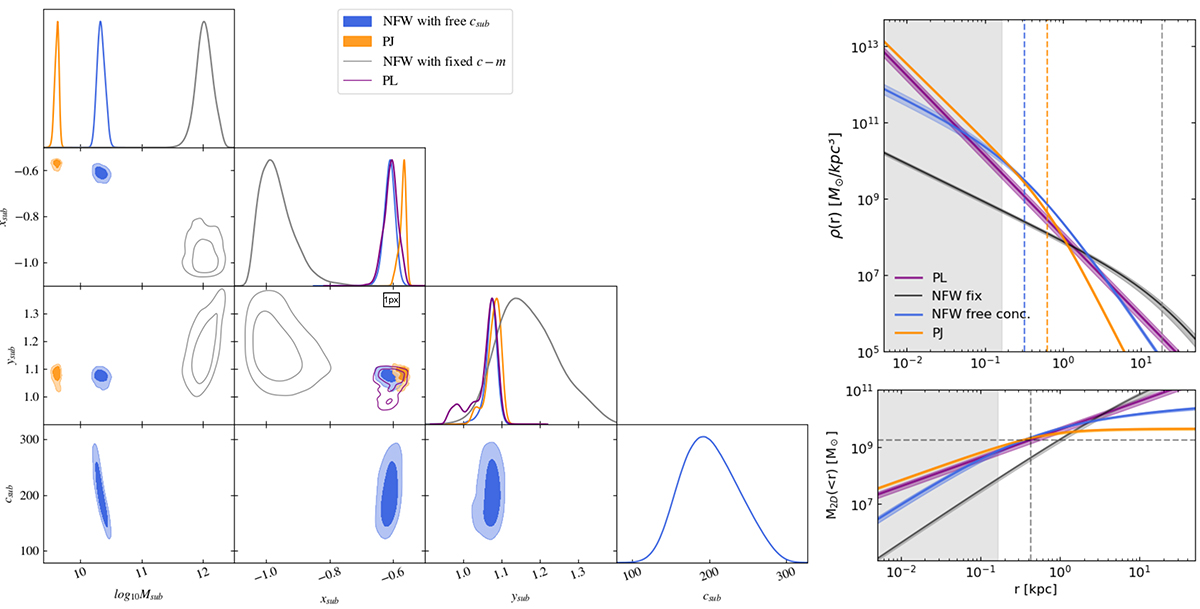
Same as Fig. 2 but for the lens system J0946+1006. Here, the NFW profile with concentration fixed by the concentration–mass relation is a worse fit to the data than the other models: a symptom is the best-fit position of the subhalo, which is very different and more uncertain than for the other profiles. Moreover, the enclosed mass in the bottom-right panel does not converge within a radius similar to the other two profiles, i.e. Req = 0.45 kpc. The best models and the full posterior distributions can be found in the appendix in Figs. A.1 and A.5.
Current usage metrics show cumulative count of Article Views (full-text article views including HTML views, PDF and ePub downloads, according to the available data) and Abstracts Views on Vision4Press platform.
Data correspond to usage on the plateform after 2015. The current usage metrics is available 48-96 hours after online publication and is updated daily on week days.
Initial download of the metrics may take a while.