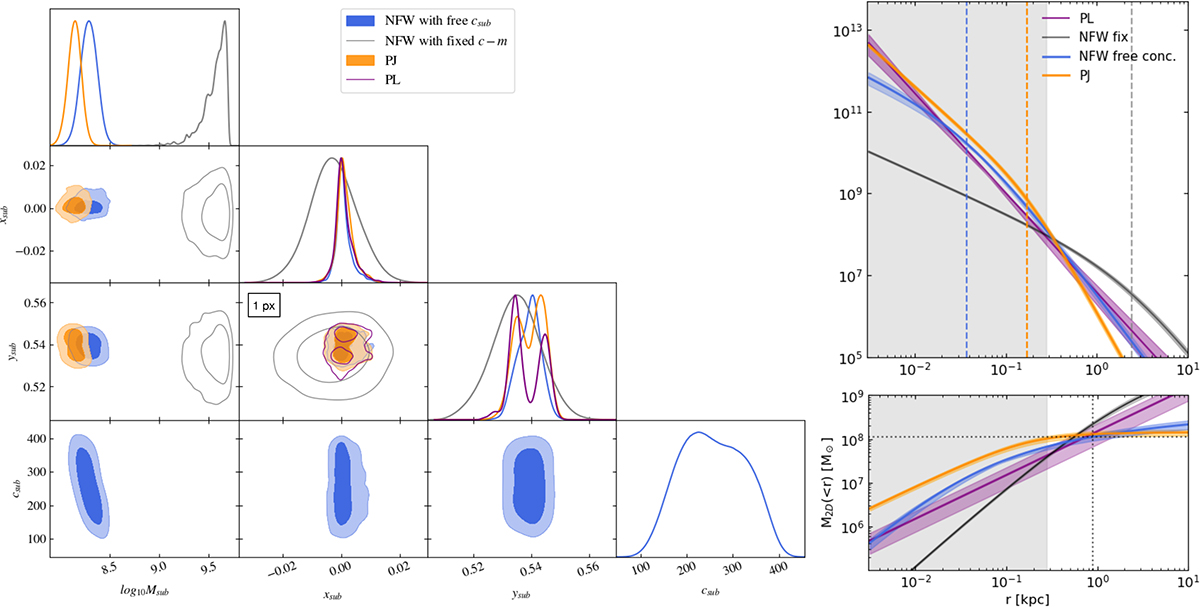
Fig. 2.
Download original image
Left: nested sampling posterior distributions for parameters describing the subhalo in the system B1938+666 for the PJ (orange) and NFW (blue and gray) profiles. In all cases, we fit for the subhalo mass Msub (in M⊙) and position (xsub and ysub, measured in arcseconds with respect to the centre of the image). We also plot the posterior of the subhalo position of the PL profile (purple), while the other parameters describing the models are plotted separately in Fig. 4. We consider two variations of the NFW profile: one (grey) where the concentration csub is fixed by the concentration–mass relation from Duffy et al. (2008) and a case (blue) where csub is left free to vary. The best-fit values derived from the posteriors are listed in Table 2. Note that we plot the mass Msub in logarithmic space for better comparing the model, and this may give the impression that the grey contours are reaching the edge of the prior, which is not the case. The black rectangle in the (xsub−ysub) panel indicates the pixel scale of the data. The best lens model and reconstructed source for the smooth and smooth+NFW cases are shown in the Appendix in Figs. A.1 and A.4 shows the posterior distribution for all parameters in all considered models. Right: radial density and projected enclosed mass profiles corresponding to the best-fit subhalo profiles in the left panel, i.e. to the values reported in Table 2 (mean and 95 CL). The profiles are calculated analytically following the definitions in Sect. 2.2. The vertical dashed lines in the top panel mark the slope transition for the NFW and PJ profiles, i.e. rs and rt. In the bottom panel, the dotted lines mark the distance at which the PJ, NFW and PL curves intersect, thus predicting the same mass, i.e. req = 0.9 kpc. The grey areas show the data resolution.
Current usage metrics show cumulative count of Article Views (full-text article views including HTML views, PDF and ePub downloads, according to the available data) and Abstracts Views on Vision4Press platform.
Data correspond to usage on the plateform after 2015. The current usage metrics is available 48-96 hours after online publication and is updated daily on week days.
Initial download of the metrics may take a while.