Fig. B.1.
Download original image
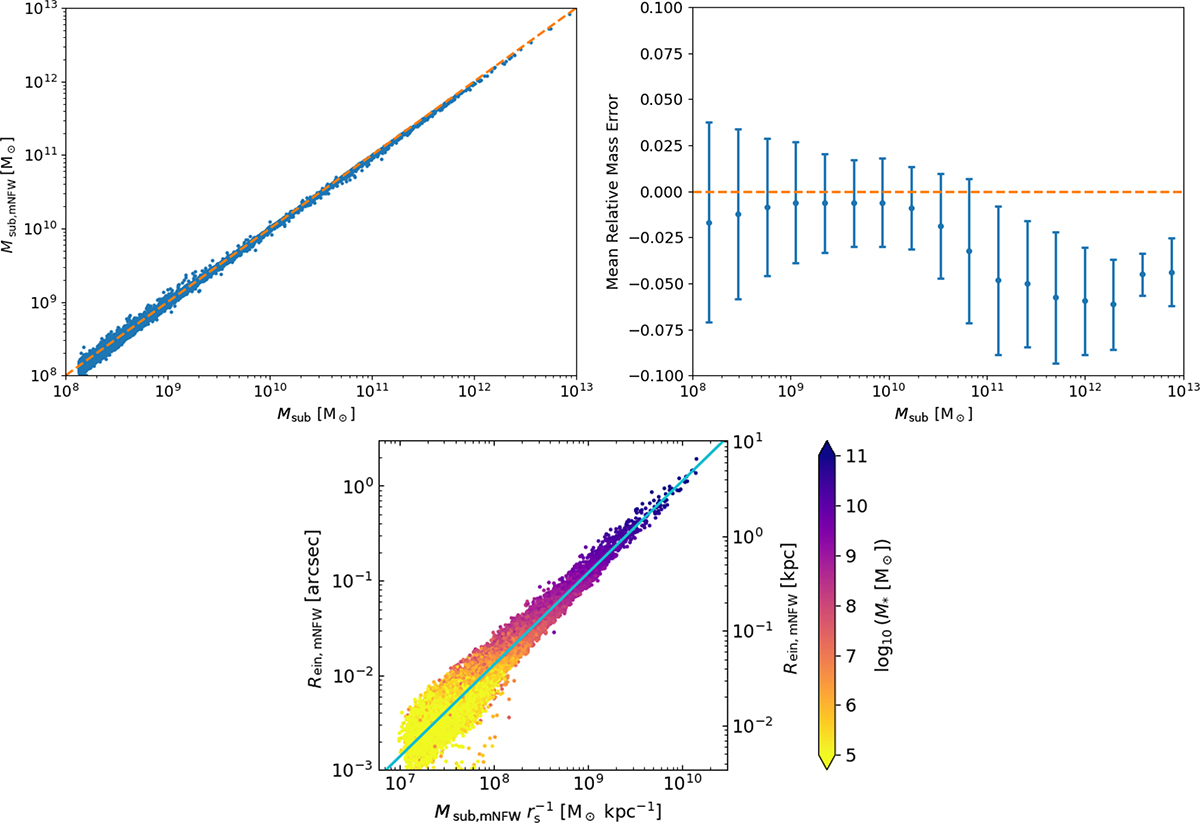
Top−left: the subhalo masses obtained by integrating the best modified NFW profile fits are plotted against the subhalo masses obtained from the particle data of the TNG50 simulation. The dashed orange line indicates where both masses are equal. Top−right: the mean relative errors of the subhalo masses obtained by integrating the best modified NFW profile fits are plotted against the true subhalo masses obtained from the simulation data for each mass bin. The standard deviations are indicated by the error bars. Bottom: Scaling of the Einstein radius (obtained by using the best modified NFW profile fits) with ![]() . The colour-coding indicates the concentration cV. The blue line shows the best power law fit.
. The colour-coding indicates the concentration cV. The blue line shows the best power law fit.
Current usage metrics show cumulative count of Article Views (full-text article views including HTML views, PDF and ePub downloads, according to the available data) and Abstracts Views on Vision4Press platform.
Data correspond to usage on the plateform after 2015. The current usage metrics is available 48-96 hours after online publication and is updated daily on week days.
Initial download of the metrics may take a while.