Fig. A.2.
Download original image
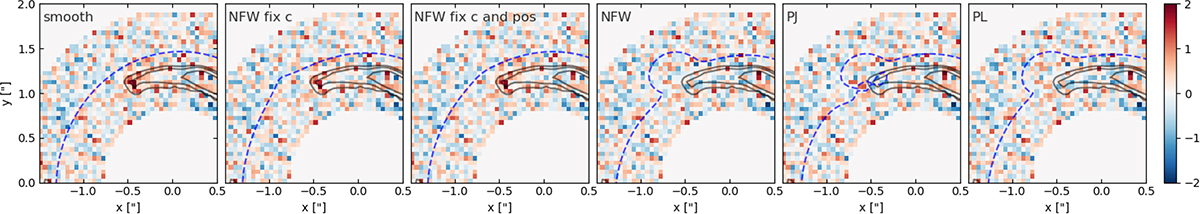
We zoom on the detection location in J0946+1006 and show the residuals between the model and the data for all considered variations of subhalo properties. In each panel, the dashed blue line shows the critical curve predicted by the model, and the black contours trace the surface brightness of the arc. In the first panel, we see a clear red spot at the edge of the lensed arc, which is close to the detection location and indicates that the smooth model cannot correctly reproduce the surface brightness distribution. The NFW models with fixed concentration (second panel) and position (third panel) cannot remove this excess, while the residuals reach the noise level when the NFW is allowed to have a higher concentration (fourth panel) or when we use a PJ or PL profile (last two panels).
Current usage metrics show cumulative count of Article Views (full-text article views including HTML views, PDF and ePub downloads, according to the available data) and Abstracts Views on Vision4Press platform.
Data correspond to usage on the plateform after 2015. The current usage metrics is available 48-96 hours after online publication and is updated daily on week days.
Initial download of the metrics may take a while.